This tutorial demonstrates how to track the usage of your extension using Google Analytics. You can find a working Google Analytics 4 sample on Github, where google-analytics.js includes all the Google Analytics related code.
Requirements
This tutorial assumes you are familiar with writing Chrome extensions. If you need information on how to write an extension, please read the Getting Started tutorial.
You must also set up a Google Analytics 4 account to track your extension. Note that when setting up the account, you can use any value in the Website's URL field, as your extension will not have an URL of its own.
Using the Google Analytics Measurement Protocol
Since Manifest V3, Chrome Extensions are not allowed to execute remote hosted code. This means you have to use the Google Analytics Measurement Protocol for tracking extension events. The Measurement Protocol lets you send events directly to Google Analytics servers via HTTP requests. A benefit of this approach is that it lets you send analytics events from everywhere in your extension, including your service worker.
Set up API credentials
The first step is to obtain an api_secret and measurement_id. Follow the Measurement Protocol documentation for how to get these for your Analytics Account.
Generate a client_id
The second step is to generate a unique identifier for a specific device/user, the client_id. The ID should stay the same, as long as the extension is installed on a user's browser. It can be an arbitrary string, but should be unique to the client. Store the client_id in chrome.storage.local to make sure it stays the same as long as the extension is installed.
Using chrome.storage.local requires the storage permission in your manifest file:
manifest.json:
{
  …
  "permissions": ["storage"],
  …
}
Then you can use chrome.storage.local to store the client_id:
function getRandomId() {
  const digits = '123456789'.split('');
  let result = '';

  for (let i = 0; i < 10; i++) {
    result += digits[Math.floor(Math.random() * 9)];
  }

  return result;
}

async function getOrCreateClientId() {
  const result = await chrome.storage.local.get('clientId');
  let clientId = result.clientId;
  if (!clientId) {
    // Generate a unique client ID, the actual value is not relevant. We use
    // the <number>.<number> format since this is typical for GA client IDs.
    const unixTimestampSeconds = Math.floor(new Date().getTime() / 1000);
    clientId = `${this.getRandomId()}.${unixTimestampSeconds}`;
    await chrome.storage.local.set({clientId});
  }
  return clientId;
}
Send an analytics event
With the API credentials and the client_id, you can send an event to Google Analytics via a fetch request:
const GA_ENDPOINT = 'https://www.google-analytics.com/mp/collect';
const MEASUREMENT_ID = `G-...`;
const API_SECRET = `...`;

fetch(
  `${GA_ENDPOINT}?measurement_id=${MEASUREMENT_ID}&api_secret=${API_SECRET}`,
  {
    method: 'POST',
    body: JSON.stringify({
      client_id: await getOrCreateClientId(),
      events: [
        {
          name: 'button_clicked',
          params: {
            id: 'my-button',
          },
        },
      ],
    }),
  }
);
This sends a button_clicked event which will appear in your Google Analytics events report. If you want to see your events in the Google Analytics Realtime Report, you need to provide two additional parameters: session_id and engagement_time_msec.
Use recommended parameters session_id and engagement_time_msec
Both session_id and engagement_time_msec are recommended parameters when using the Google Analytics Measurement Protocol as they are required for user activity to display in standard reports like Realtime.
A session_id describes a period of time, during which a user continuously interacts with your extension. By default, a session ends after 30 minutes of user inactivity. There is no limit to how long a session can last.
In Chrome extensions, unlike in normal websites, there is no clear notion of a user session. Hence, you must define what a user session means in your extension. For example, every new user interaction might be a new session. In that case, you can simply generate a new session id with every event (i.e. using a timestamp).
The following example demonstrates an approach that will timeout a new session after 30 minutes of no events being reported (this time can be customized to better suit your extension’s user behavior). The example uses chrome.storage.session to store the active session while the browser is running. Together with the session we store the last time an event was fired. This way we can tell if the active session has expired:
const SESSION_EXPIRATION_IN_MIN = 30;

async function getOrCreateSessionId() {
  // Store session in memory storage
  let {sessionData} = await chrome.storage.session.get('sessionData');
  // Check if session exists and is still valid
  const currentTimeInMs = Date.now();
  if (sessionData && sessionData.timestamp) {
    // Calculate how long ago the session was last updated
    const durationInMin = (currentTimeInMs - sessionData.timestamp) / 60000;
    // Check if last update lays past the session expiration threshold
    if (durationInMin > SESSION_EXPIRATION_IN_MIN) {
      // Delete old session id to start a new session
      sessionData = null;
    } else {
      // Update timestamp to keep session alive
      sessionData.timestamp = currentTimeInMs;
      await chrome.storage.session.set({sessionData});
    }
  }
  if (!sessionData) {
    // Create and store a new session
    sessionData = {
      session_id: currentTimeInMs.toString(),
      timestamp: currentTimeInMs.toString(),
    };
    await chrome.storage.session.set({sessionData});
  }
  return sessionData.session_id;
}
The following example adds session_id and engagement_time_msec to the previous button click event request. For engagement_time_msec you can provide a default value of 100 ms.
const GA_ENDPOINT = "https://www.google-analytics.com/mp/collect";
const MEASUREMENT_ID = `G-...`;
const API_SECRET = `...`;
const DEFAULT_ENGAGEMENT_TIME_IN_MSEC = 100;

fetch(
`${GA_ENDPOINT}?measurement_id=${MEASUREMENT_ID}&api_secret=${API_SECRET}`,
  {
    method: "POST",
    body: JSON.stringify({
      client_id: await getOrCreateClientId(),
      events: [
        {
          name: "button_clicked",
          params: {
            session_id: await this.getOrCreateSessionId(),
            engagement_time_msec: DEFAULT_ENGAGEMENT_TIME_IN_MSEC,
            id: "my-button",
          },
        },
      ],
    }),
  }
);
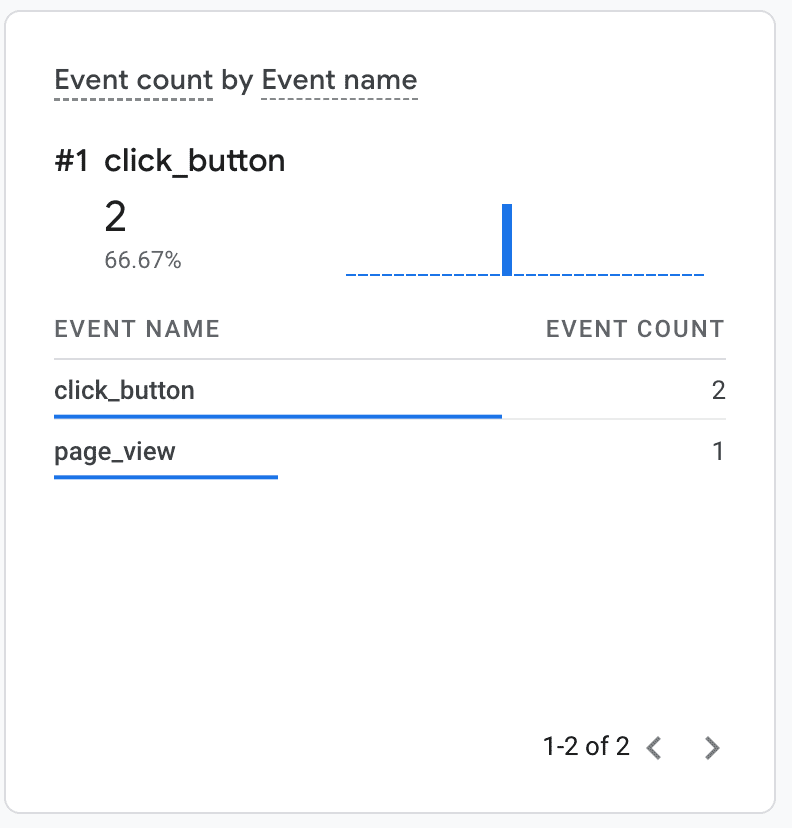
The event will be displayed as follows in the Google Analytics Realtime report.

Tracking page views in popup, side panel, and extension pages
The Google Analytics Measurement Protocol supports a special page_view event for tracking page views. Use this to track users visiting your popup pages, side panel or an extension page in a new tab. The page_view event also requires the page_title and page_location parameters. The following example fires a page view event at the document load event for an extension popup.:
popup.js:
window.addEventListener("load", async () => {
  fetch(`${GA_ENDPOINT}?measurement_id=${MEASUREMENT_ID}&api_secret=${API_SECRET}`,
  {
    method: "POST",
    body: JSON.stringify({
      client_id: await getOrCreateClientId(),
      events: [
        {
          name: "page_view",
          params: {
            session_id: await getOrCreateSessionId(),
            engagement_time_msec: DEFAULT_ENGAGEMENT_TIME_IN_MSEC,
            page_title: document.title,
            page_location: document.location.href
          },
        },
      ],
    }),
  });
});
The popup.js script needs to be imported in your popup’s html file and should run before any other script is executed:
<!DOCTYPE html>
<html lang="en">
  <head>
    <meta charset="UTF-8" />
    <meta name="viewport" content="width=device-width, initial-scale=1.0" />
    <title>Analytics Demo Popup</title>
    <script src="./popup.js" type="module"></script>
  </head>
  <body>
    <h1>Analytics Demo</h1>
  </body>
</html>
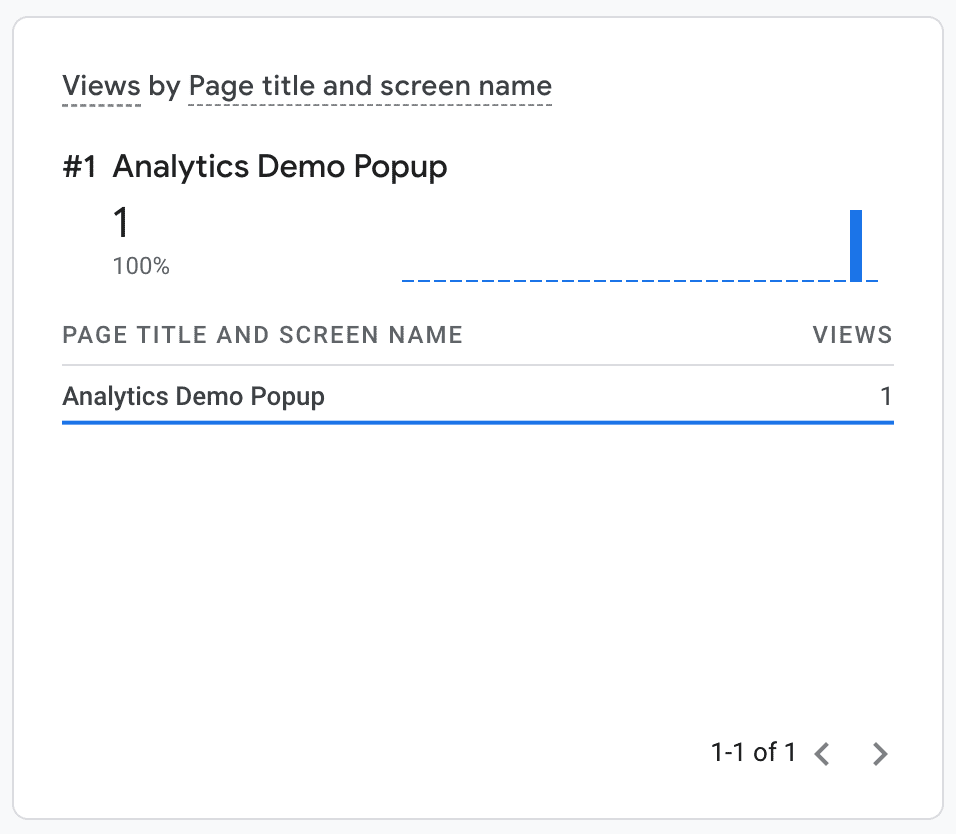
The popup view will be displayed like any other page view in the Google Analytics Realtime report:

Tracking analytics events in service workers
Using the Google Analytics Measurement Protocol makes it possible to track analytics events in extension service workers. For example, by listening to the unhandledrejection event in your service worker, you can log any uncaught exceptions in your service worker to Google Analytics, which can greatly help to debug problems your users might report.
service-worker.js:
addEventListener("unhandledrejection", async (event) => {
  `${GA_ENDPOINT}?measurement_id=${MEASUREMENT_ID}&api_secret=${API_SECRET}`,
  {
    method: "POST",
    body: JSON.stringify({
      client_id: getOrCreateClientId(),
      events: [
        {
          // Note: 'error' is a reserved event name and cannot be used
          // see https://developers.google.com/analytics/devguides/collection/protocol/ga4/reference?client_type=gtag#reserved_names
          name: "extension_error",
          params: {
            session_id: await this.getOrCreateSessionId(),
            engagement_time_msec: DEFAULT_ENGAGEMENT_TIME_IN_MSEC,
            message: error.message,
            stack: error.stack,
          },
        },
      ],
    }),
  }
});
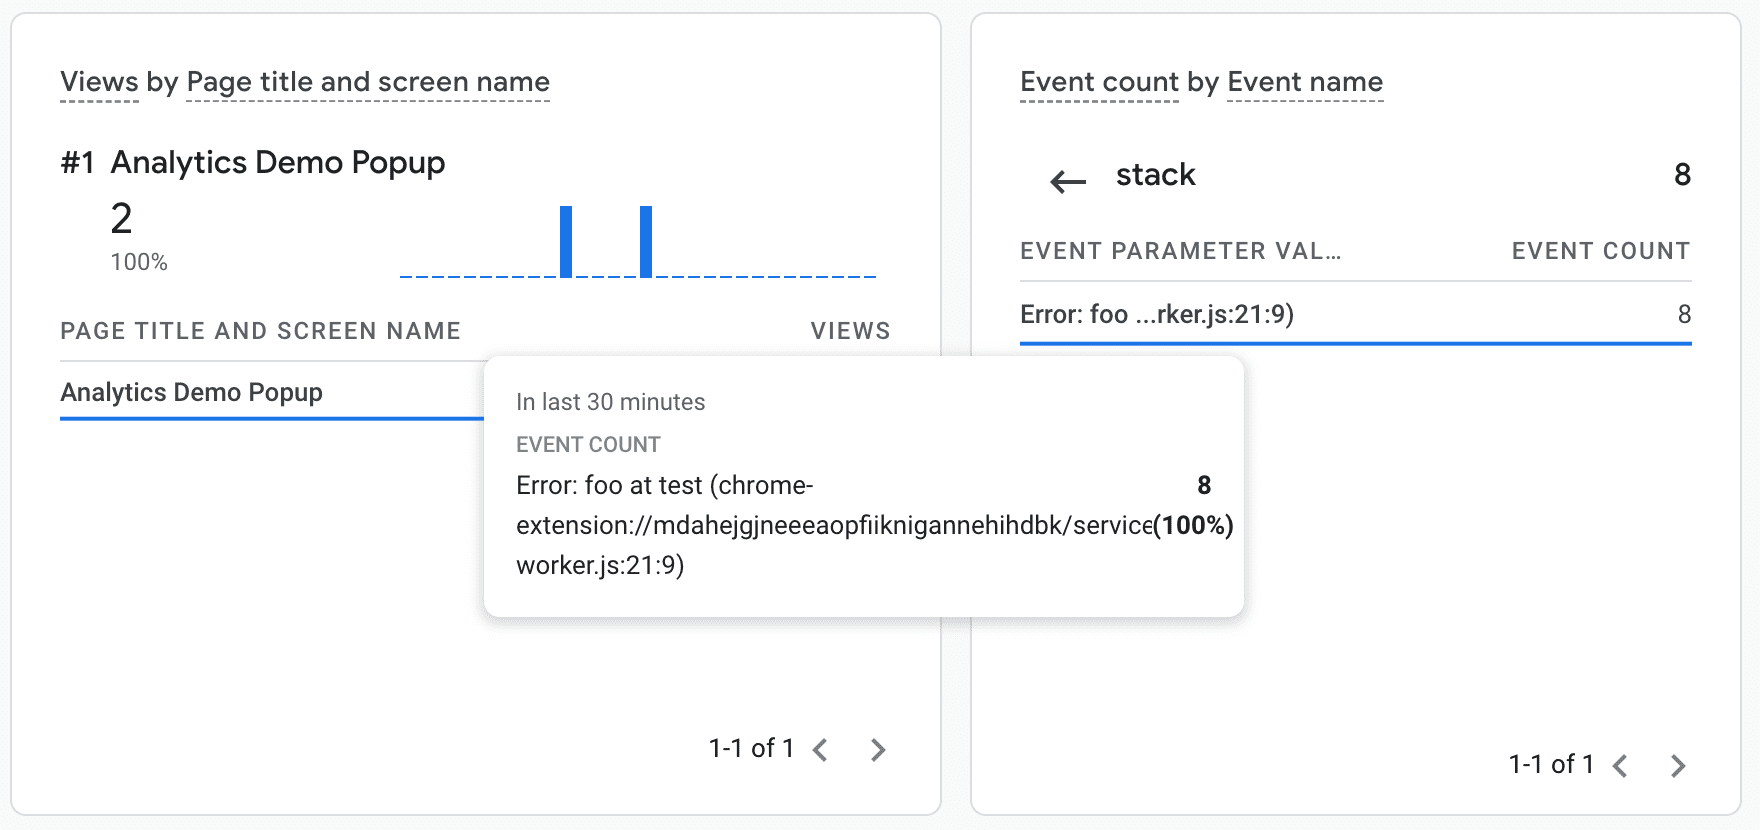
You can now see the error event in your Google Analytics reports:

Debugging
Google Analytics provides two helpful features for debugging analytics events into your extension:
- A special debugging endpoint
https://www.google-analytics.com**/debug**/mp/collectthat will report any errors in your event definitions. - The Google Analytics Realtime Report that will display events as they come in.
