Learn how to record heap snapshots with Memory > Profiles > Heap snapshot and find memory leaks.
The heap profiler shows memory distribution by your page's JavaScript objects and related DOM nodes. Use it to take JS heap snapshots, analyze memory graphs, compare snapshots, and find memory leaks. For more information, see Objects retaining tree.
Take a snapshot
To take a heap snapshot:
- On a page you want to profile, open DevTools and navigate to the Memory panel.
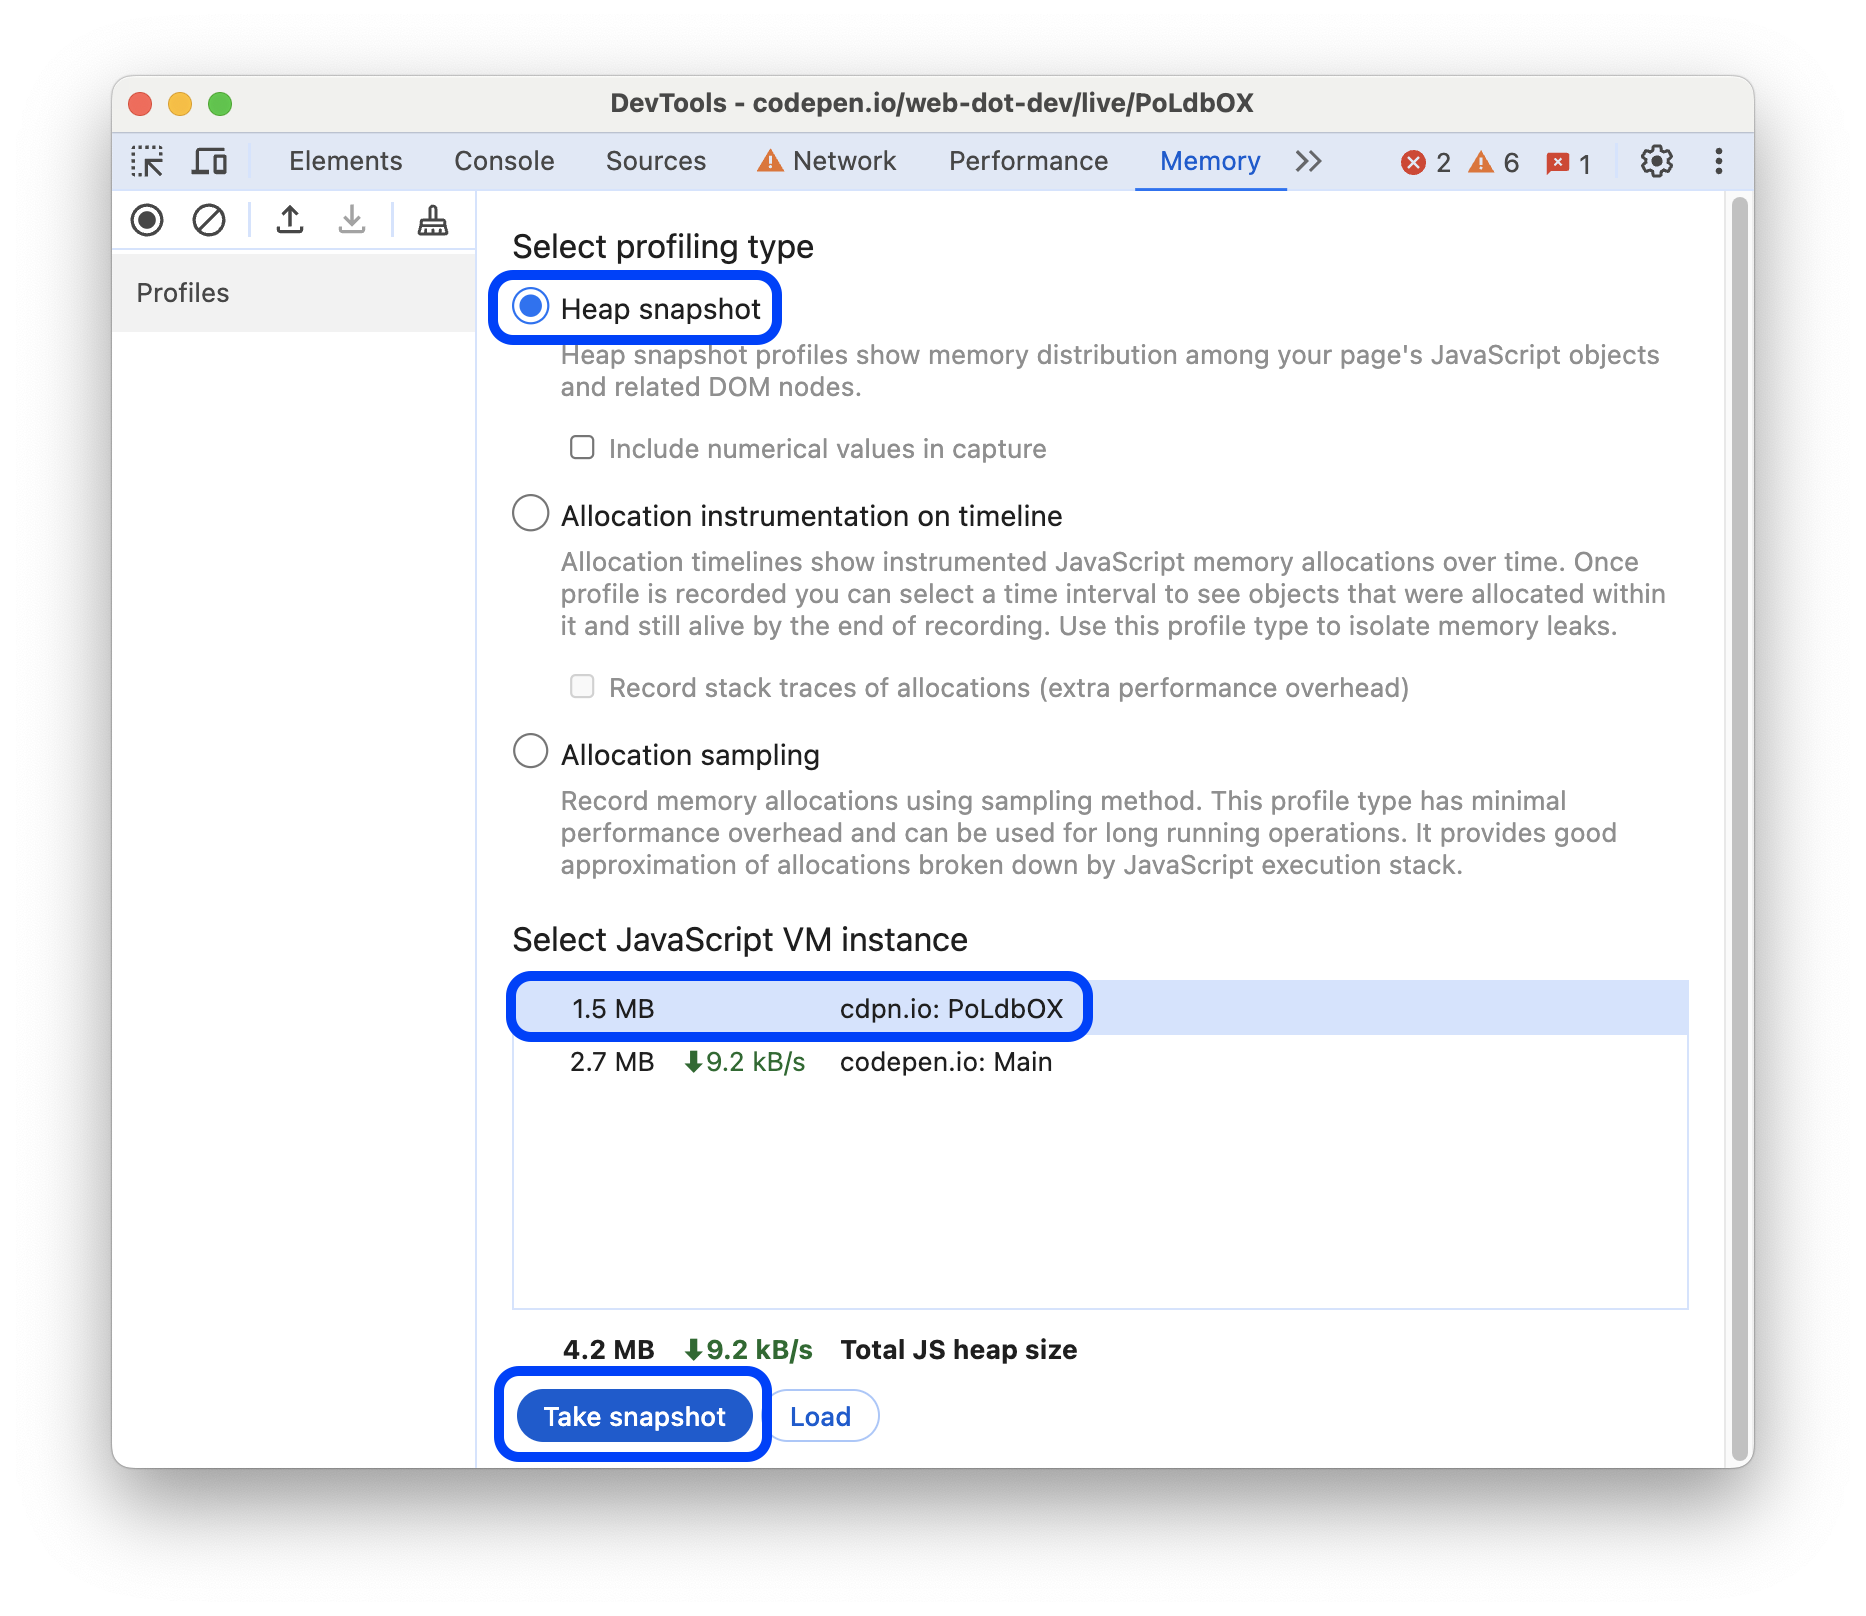
- Select the Heap snapshot profiling type, then select a JavaScript VM instance, and click Take snapshot.
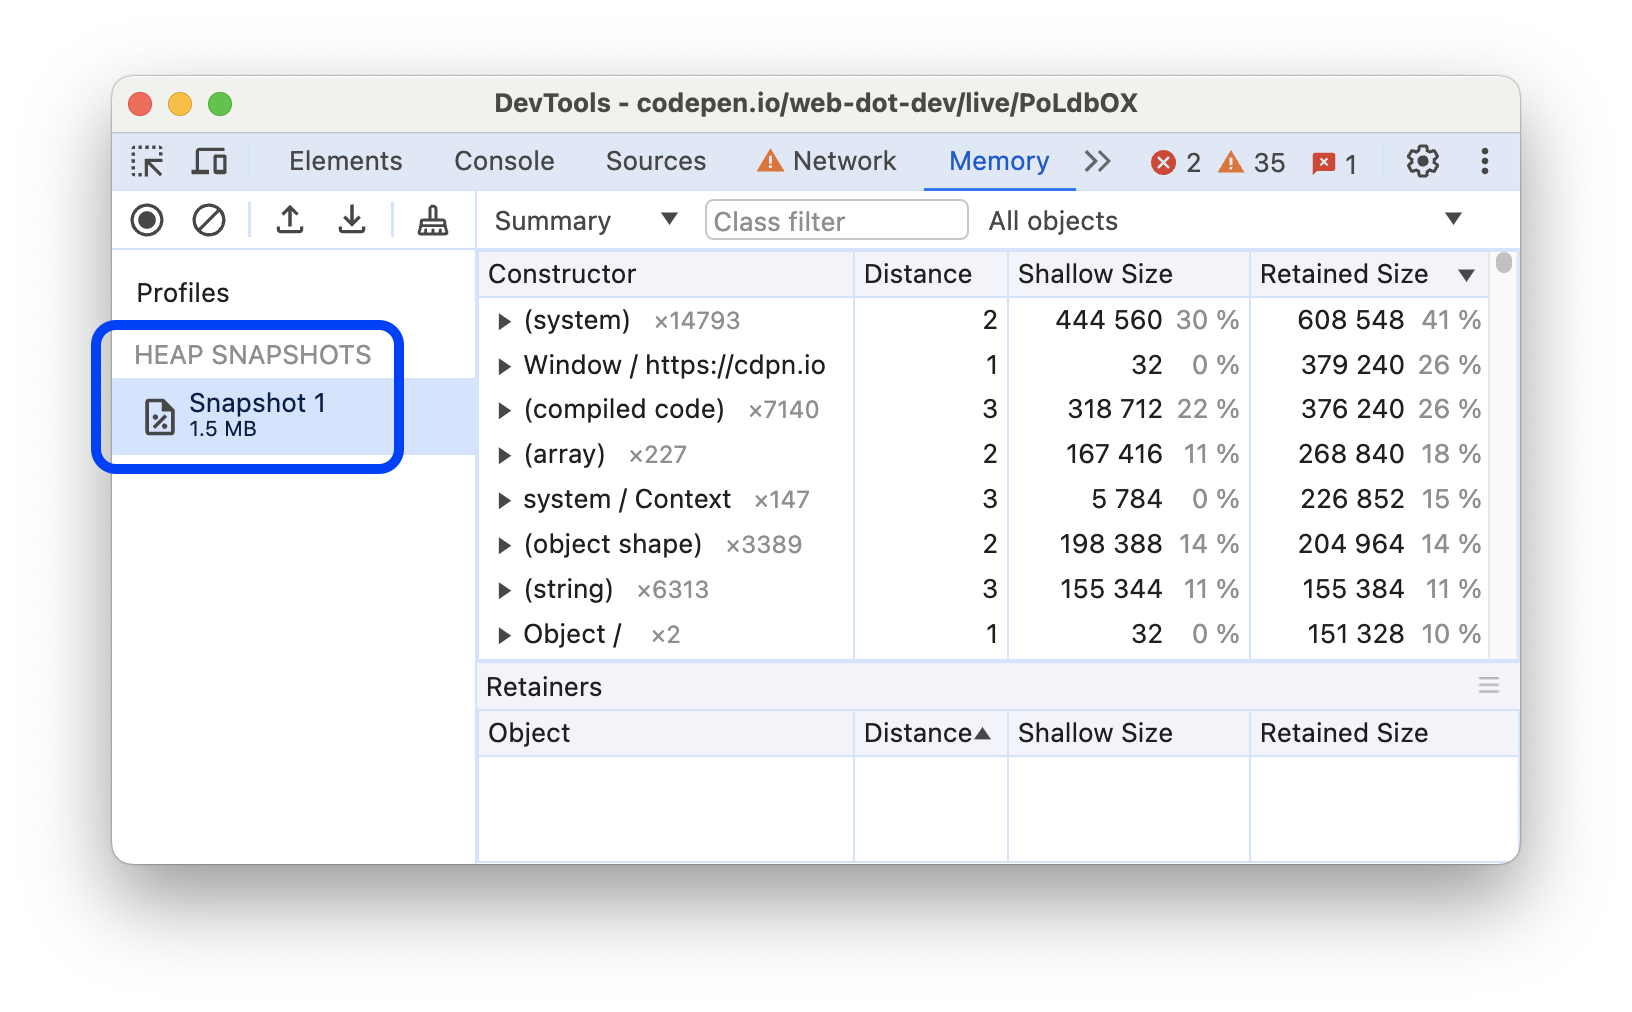
When the Memory panel loads and parses the snapshot, it shows the total size of reachable JavaScript objects below the snapshot title in the HEAP SNAPSHOTS section.
Snapshots show only the objects from the memory graph that are reachable from the global object. Taking a snapshot always starts with garbage collection.
Clear snapshots
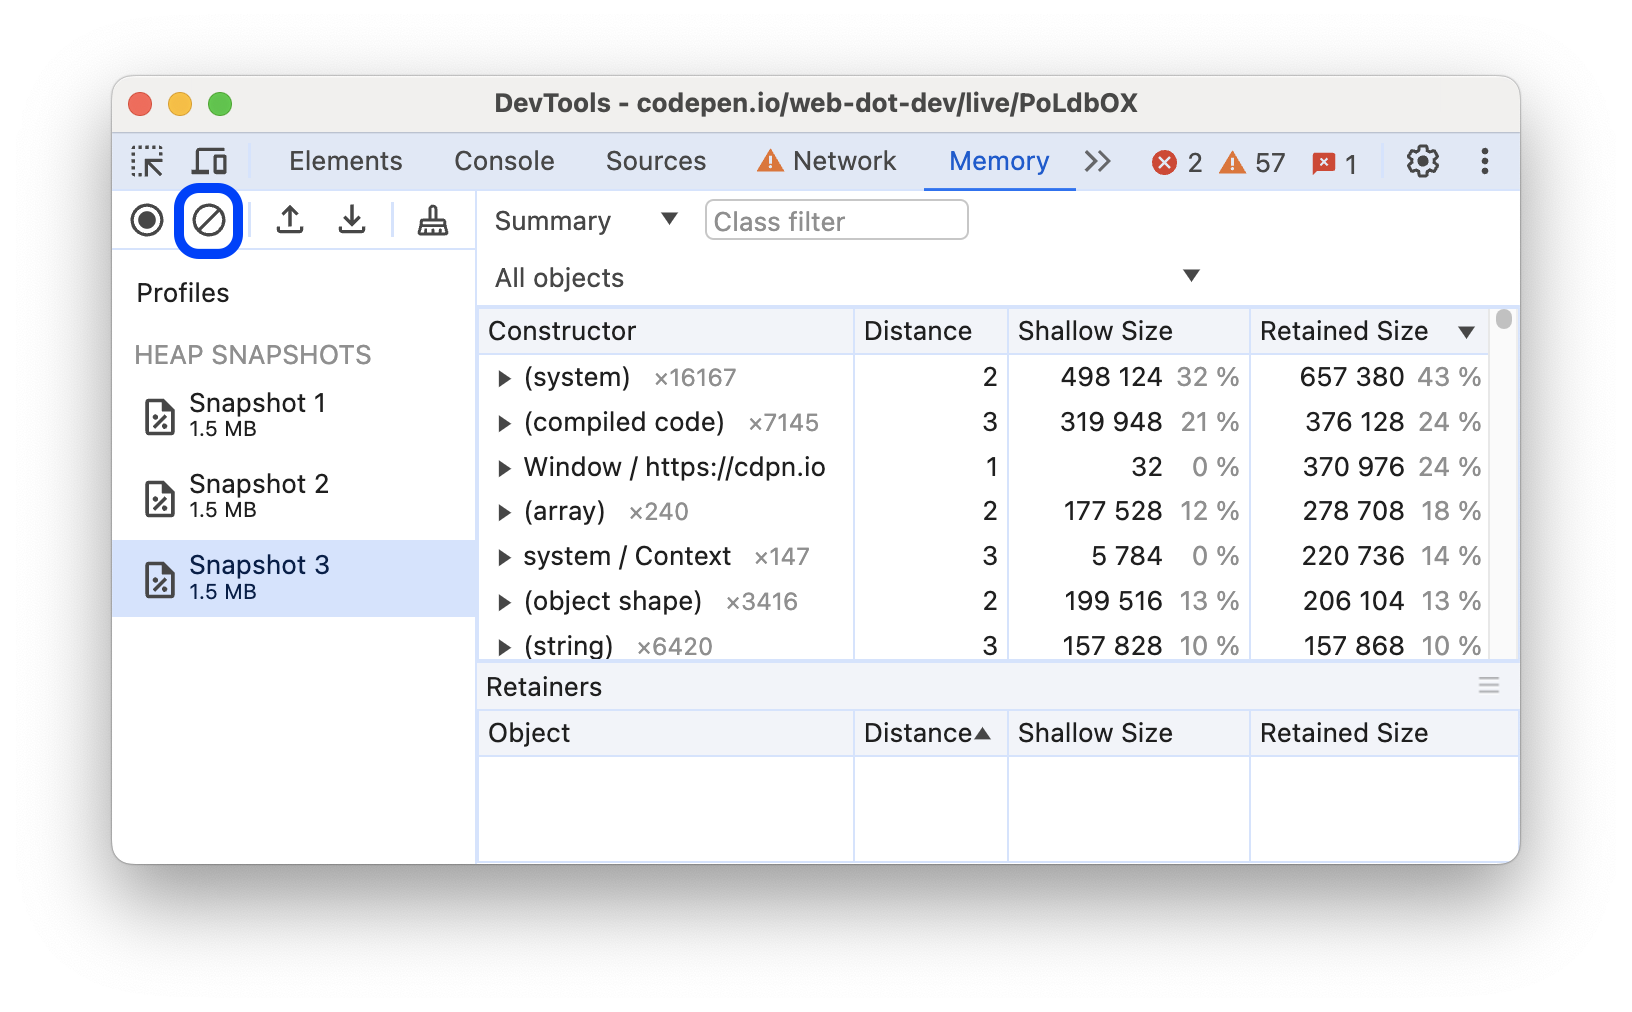
To remove all snapshots, click Clear all profiles:
View snapshots
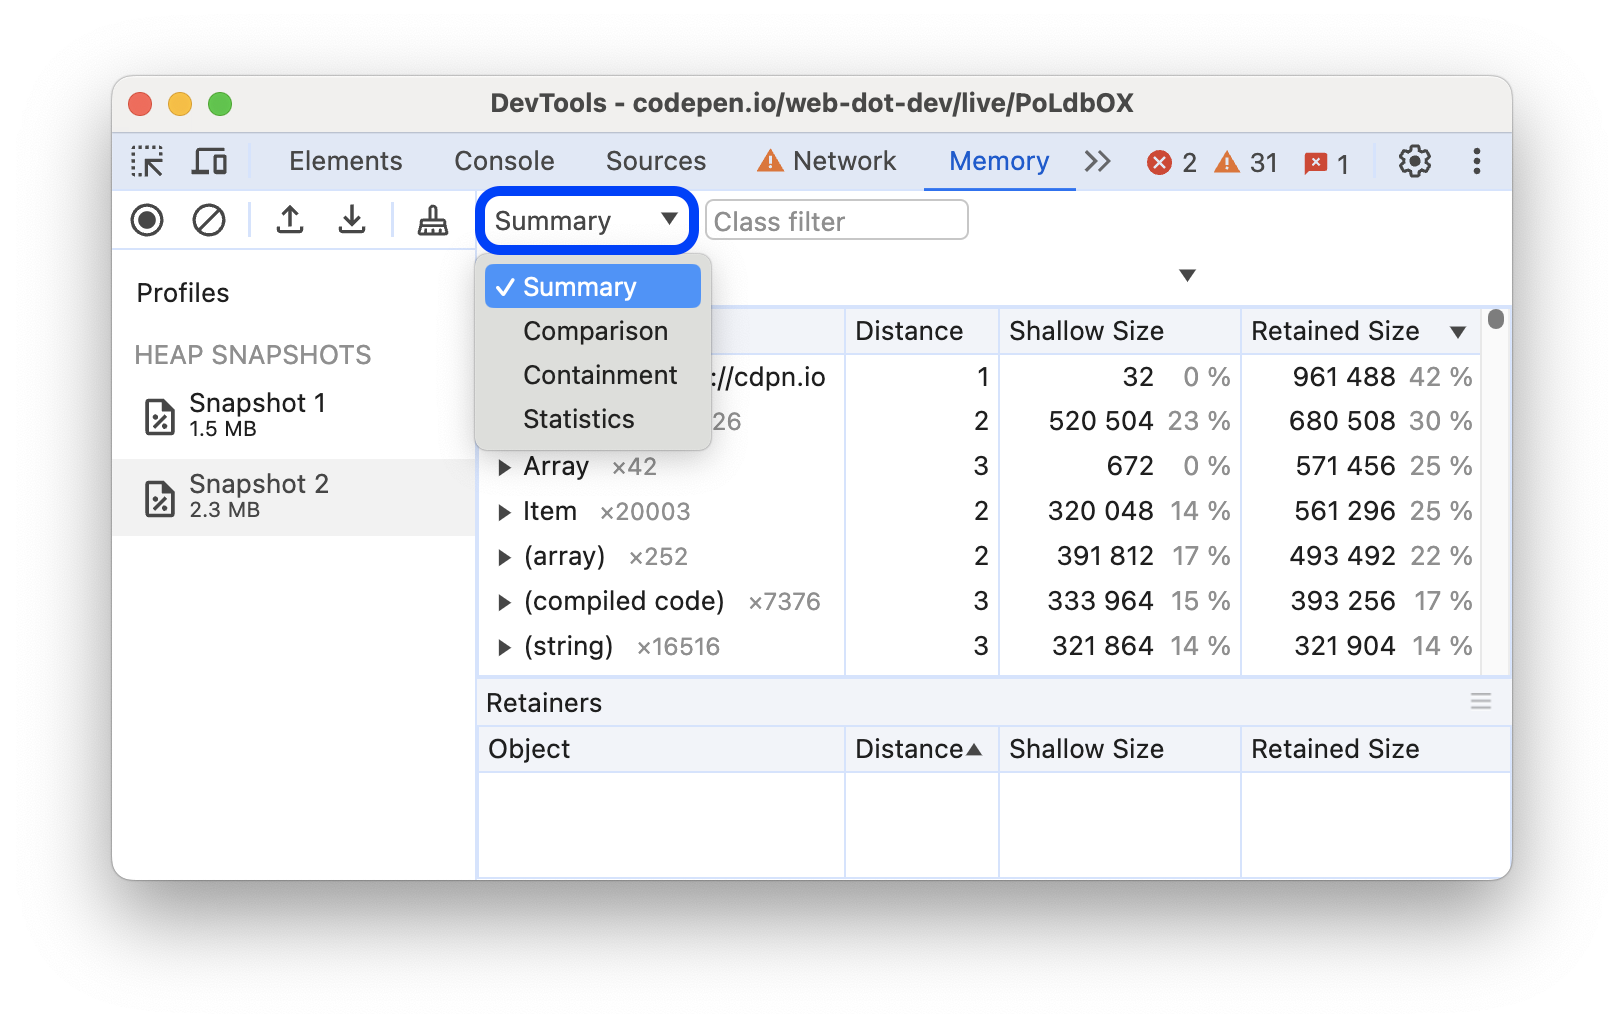
To inspect snapshots from different perspectives for different purposes, select one of the views from the drop-down menu at the top:
| View | Content | Purpose |
|---|---|---|
| Summary | Objects grouped by constructor names and sources. | Use it to hunt down objects and their memory use based on type. Helpful for tracking DOM leaks. |
| Comparison | Differences between two snapshots. | Use it to compare two (or more) snapshots, before and after an operation. Confirm the presence and cause of a memory leak by inspecting the delta in freed memory and reference count. |
| Containment | Heap contents | Provides a better view of object structure, and helps analyze objects referenced in the global namespace (window) to find what keeps them around. Use it to analyze closures and dive into your objects at a low level. |
| Statistics | Pie chart of memory allocation | See the realtive sizes of memory parts allocated to code, strings, JS arrays, typed arrays, and system objects. |
Summary view
Initially, a heap snapshot opens in the Summary view that lists Constructors in a column. Constructors are named after the JavaScript function that created the object, plain objects names are based on the proper they contain, and some names are special entries. All objects are grouped by their names first, then by the line in the source file they come from, for example, source-file.js:line-number.
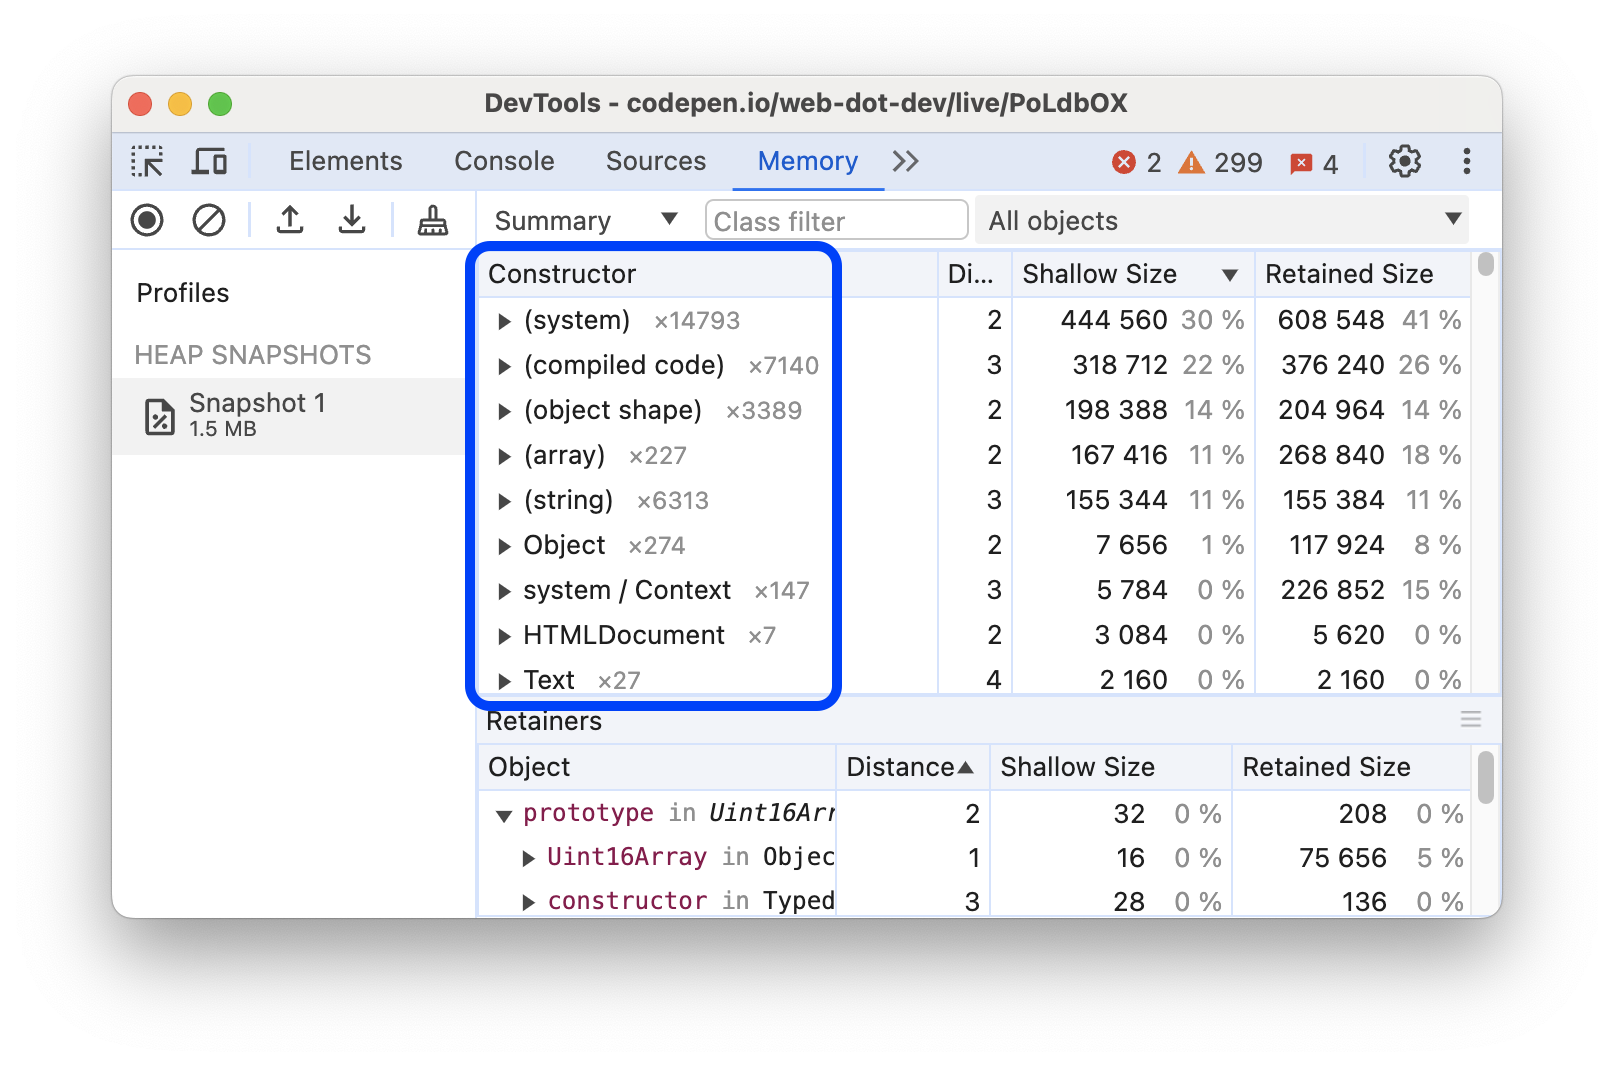
You can expand grouped constructors to see the objects they instantiated.
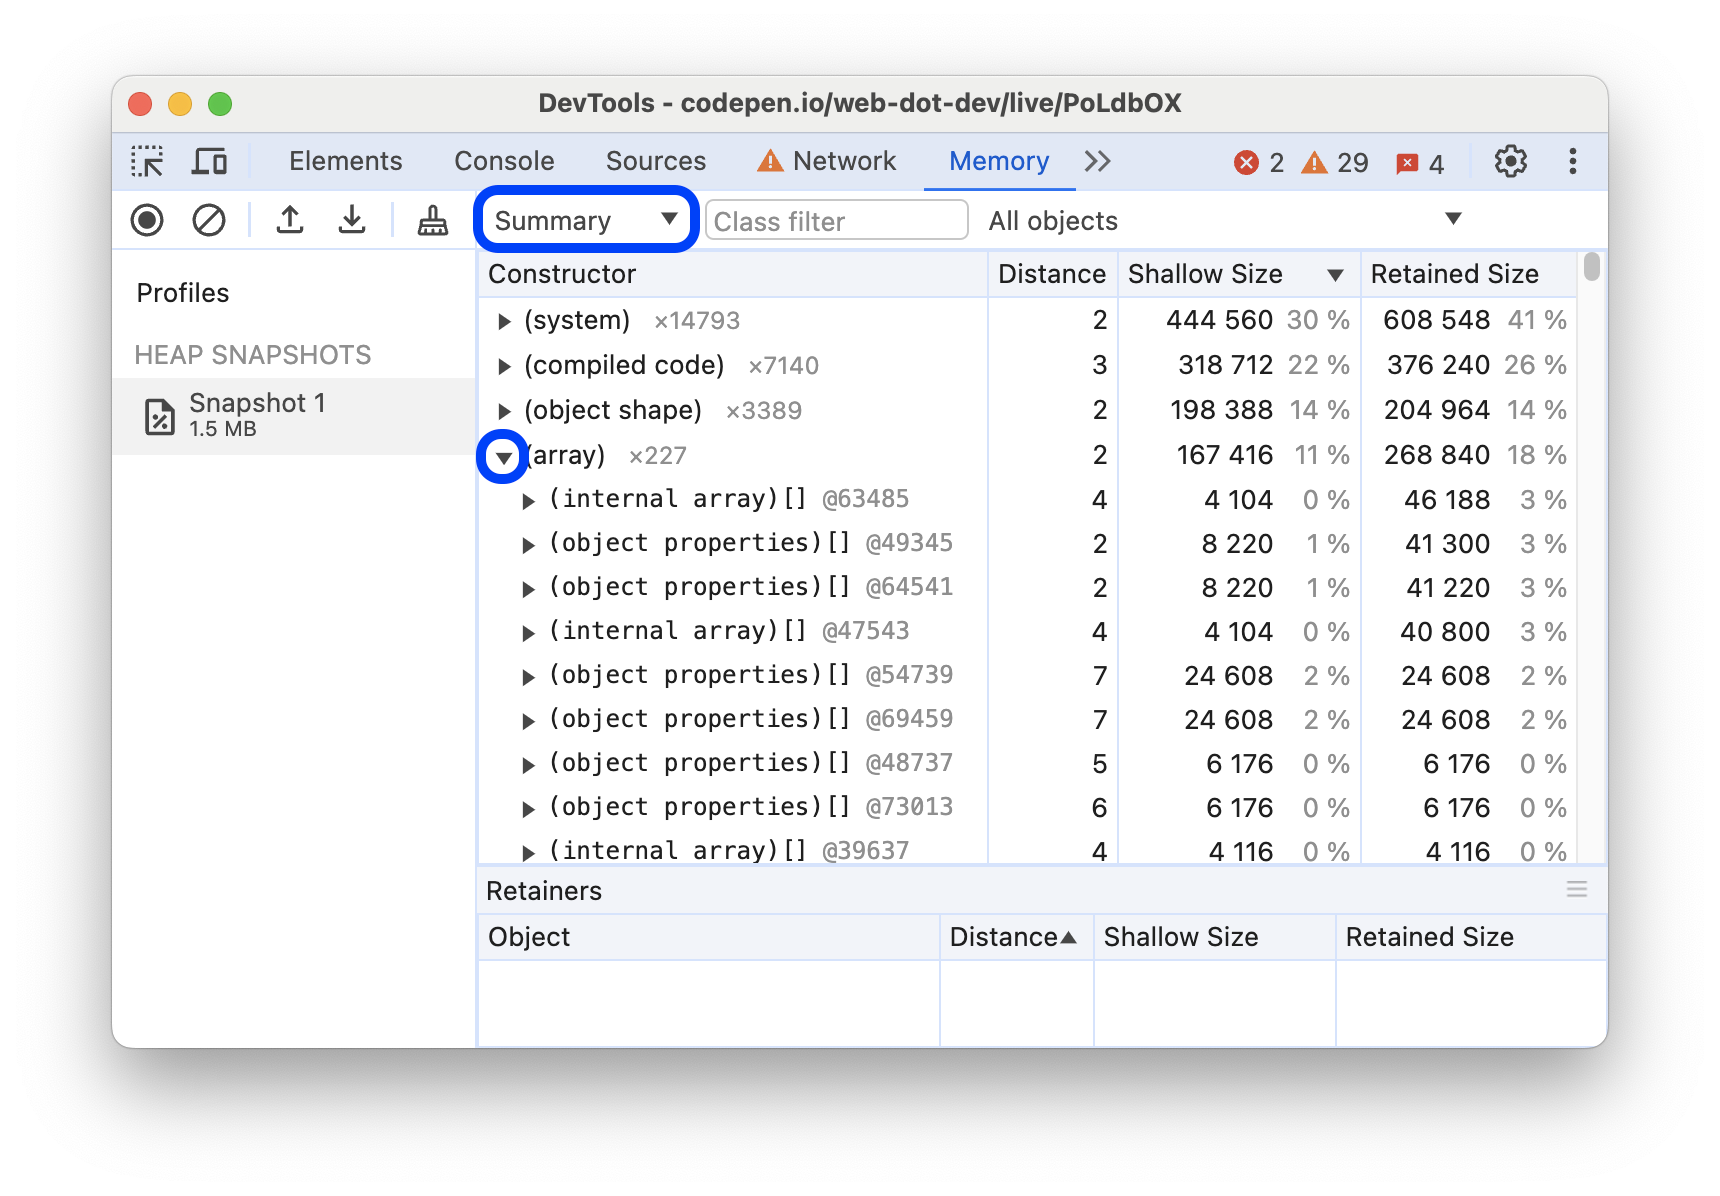
To filter out irrelevant constructors, type a name that you want to inspect in the Class filter at the top of the Summary view.
The numbers next to constructor names indicate the total number of objects created with the constructor. The Summary view also shows the following columns:
- Distance shows the distance to the root using the shortest simple path of nodes.
- Shallow size shows the sum of shallow sizes of all objects created by a certain constructor. The shallow size is the size of memory held by an object itself. Generally, arrays and strings have larger shallow sizes. See also Object sizes.
- Retained size shows the maximum retained size among the same set of objects. Retained size is the size of memory that you can free by deleting an object and making its dependents no longer reachable. See also Object sizes.
When you expand a constructor, the Summary view shows you all of its instances. Each instance gets a breakdown of its shallow and retained sizes in the corresponding columns. The number after the @ character is the object's unique ID. It lets you compare heap snapshots on per-object basis.
Constructor filters
Summary view lets you filter constructors based on common cases of inefficient memory usage.
To use these filters, select one of the following options from the rightmost drop-down menu in the action bar:
- All objects: all objects captured by the current snapshot. Set by default.
- Objects allocated before snapshot 1: objects that were created and remained in memory before the first snapshot was taken.
- Objects allocated between Snapshots 1 and Snapshots 2: view the difference in objects between the most recent snapshot and the previous snapshot. Each new snapshot adds an increment of this filter to the drop-down list.
- Duplicated strings: string values that have been stored multiple times in memory.
- Objects retained by detached nodes: objects that are kept alive because a detached DOM node references them.
- Objects retained by the DevTools console: objects kept in memory because they were evaluated or interacted with through the DevTools console.
Special entries in Summary
In addition to grouping by constructors, the Summary view also groups objects by:
- Built-in functions such as
ArrayorObject. - HTML elements grouped by their tags, for example,
<div>,<a>,<img>, and others. - Functions you defined in your code.
- Special categories that aren't based on constructors.
(array)
This category includes various internal array-like objects that don't directly correspond to objects visible in JavaScript.
For example, the contents of JavaScript Array objects are stored in a secondary internal object named (object elements)[], to allow easier resizing. Similarly, the named properties in JavaScript objects are often stored in secondary internal objects named (object properties)[] that are also listed in the (array) category.
(compiled code)
This category includes internal data that V8 needs so that it can run functions defined by JavaScript or WebAssembly. Each function can be represented in a variety of ways, from small and slow to large and fast.
V8 automatically manages memory usage in this category. If a function runs many times, V8 uses more memory for that function so that it can run faster. If a function hasn't run in a while, V8 may clear the internal data for that function.
(concatenated string)
When V8 concatenates two strings, such as with the JavaScript + operator, it may choose to represent the result internally as a "concatenated string" also known as the Rope data structure.
Rather than copying all of the characters of the two source strings into a new string, V8 allocates a small object with internal fields called first and second, which point to the two source strings. This lets V8 save time and memory. From the perspective of JavaScript code, these are just normal strings, and they behave like any other string.
InternalNode
This category represents objects allocated outside V8, such as C++ objects defined by Blink.
To see C++ class names, use Chrome for Testing and do the following:
- Open DevTools and turn on Settings > Experiments > Show option to expose internals in heap snapshots.
- Open the Memory panel, select Heap snapshot, and turn on Expose internals (includes additional implementation-specific details).
- Reproduce the issue that caused the
InternalNodeto retain a lot of memory. - Take a heap snapshot. In this snapshot, objects have C++ class names instead of
InternalNode.
(object shape)
As described in Fast Properties in V8, V8 tracks hidden classes (or shapes) so that multiple objects with the same properties in the same order can be represented efficiently. This category contains those hidden classes, called system / Map (unrelated to JavaScript Map), and related data.
(sliced string)
When V8 needs to take a substring, such as when JavaScript code calls String.prototype.substring(), V8 may choose to allocate a sliced string object rather than copying all of the relevant characters from the original string. This new object contains a pointer to the original string and describes which range of characters from the original string to use.
From the perspective of JavaScript code, these are just normal strings, and they behave like any other string. If a sliced string is retaining a lot of memory, then the program may have triggered Issue 2869 and might benefit from taking deliberate steps to "flatten" the sliced string.
system / Context
Internal objects of type system / Context contain local variables from a closure—a JavaScript scope that a nested function can access.
Every function instance contains an internal pointer to the Context in which it executes, so that it can access those variables. Even though Context objects aren't directly visible from JavaScript, you do have direct control over them.
(system)
This category contains various internal objects that haven't (yet) been categorized in any more meaningful way.
Comparison view
The Comparison view lets you find leaked objects by comparing multiple snapshots to each other. For example, doing an action and reversing it, like opening a document and closing it, shouldn't leave extra objects behind.
To verify that a certain operation doesn't create leaks:
- Take a heap snapshot before performing an operation.
- Perform an operation. That is, interact with a page in some way that you think might be causing a leak.
- Perform a reverse operation. That is, do the opposite interaction and repeat it a few times.
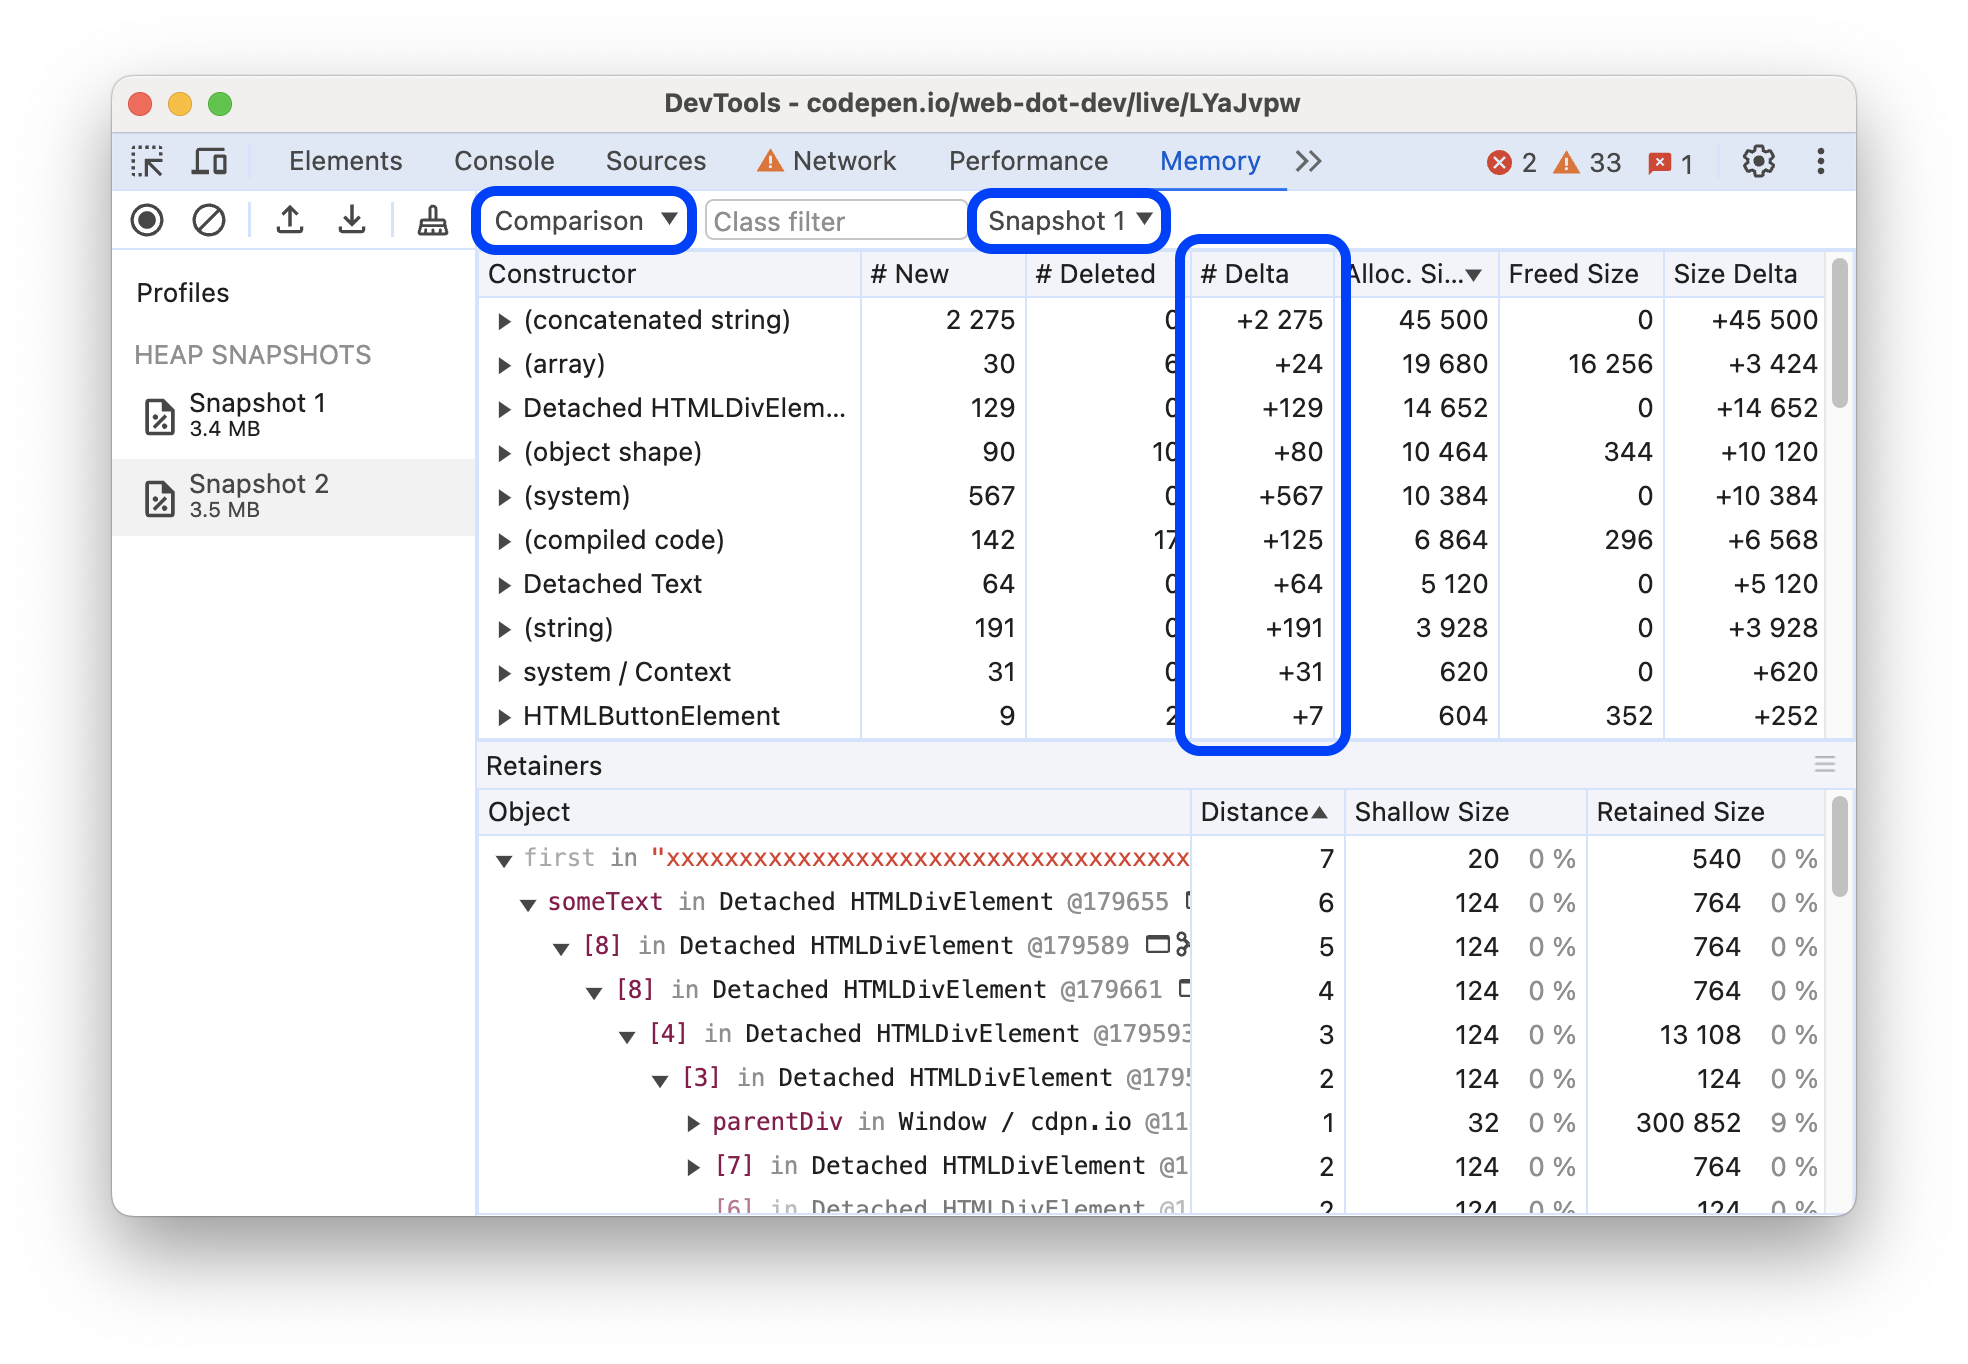
- Take a second heap snapshot and change its view to Comparison, comparing it to Snapshot 1.
The Comparison view shows the difference between two snapshots. When expanding a total entry, added and deleted object instances are shown:
Containment view
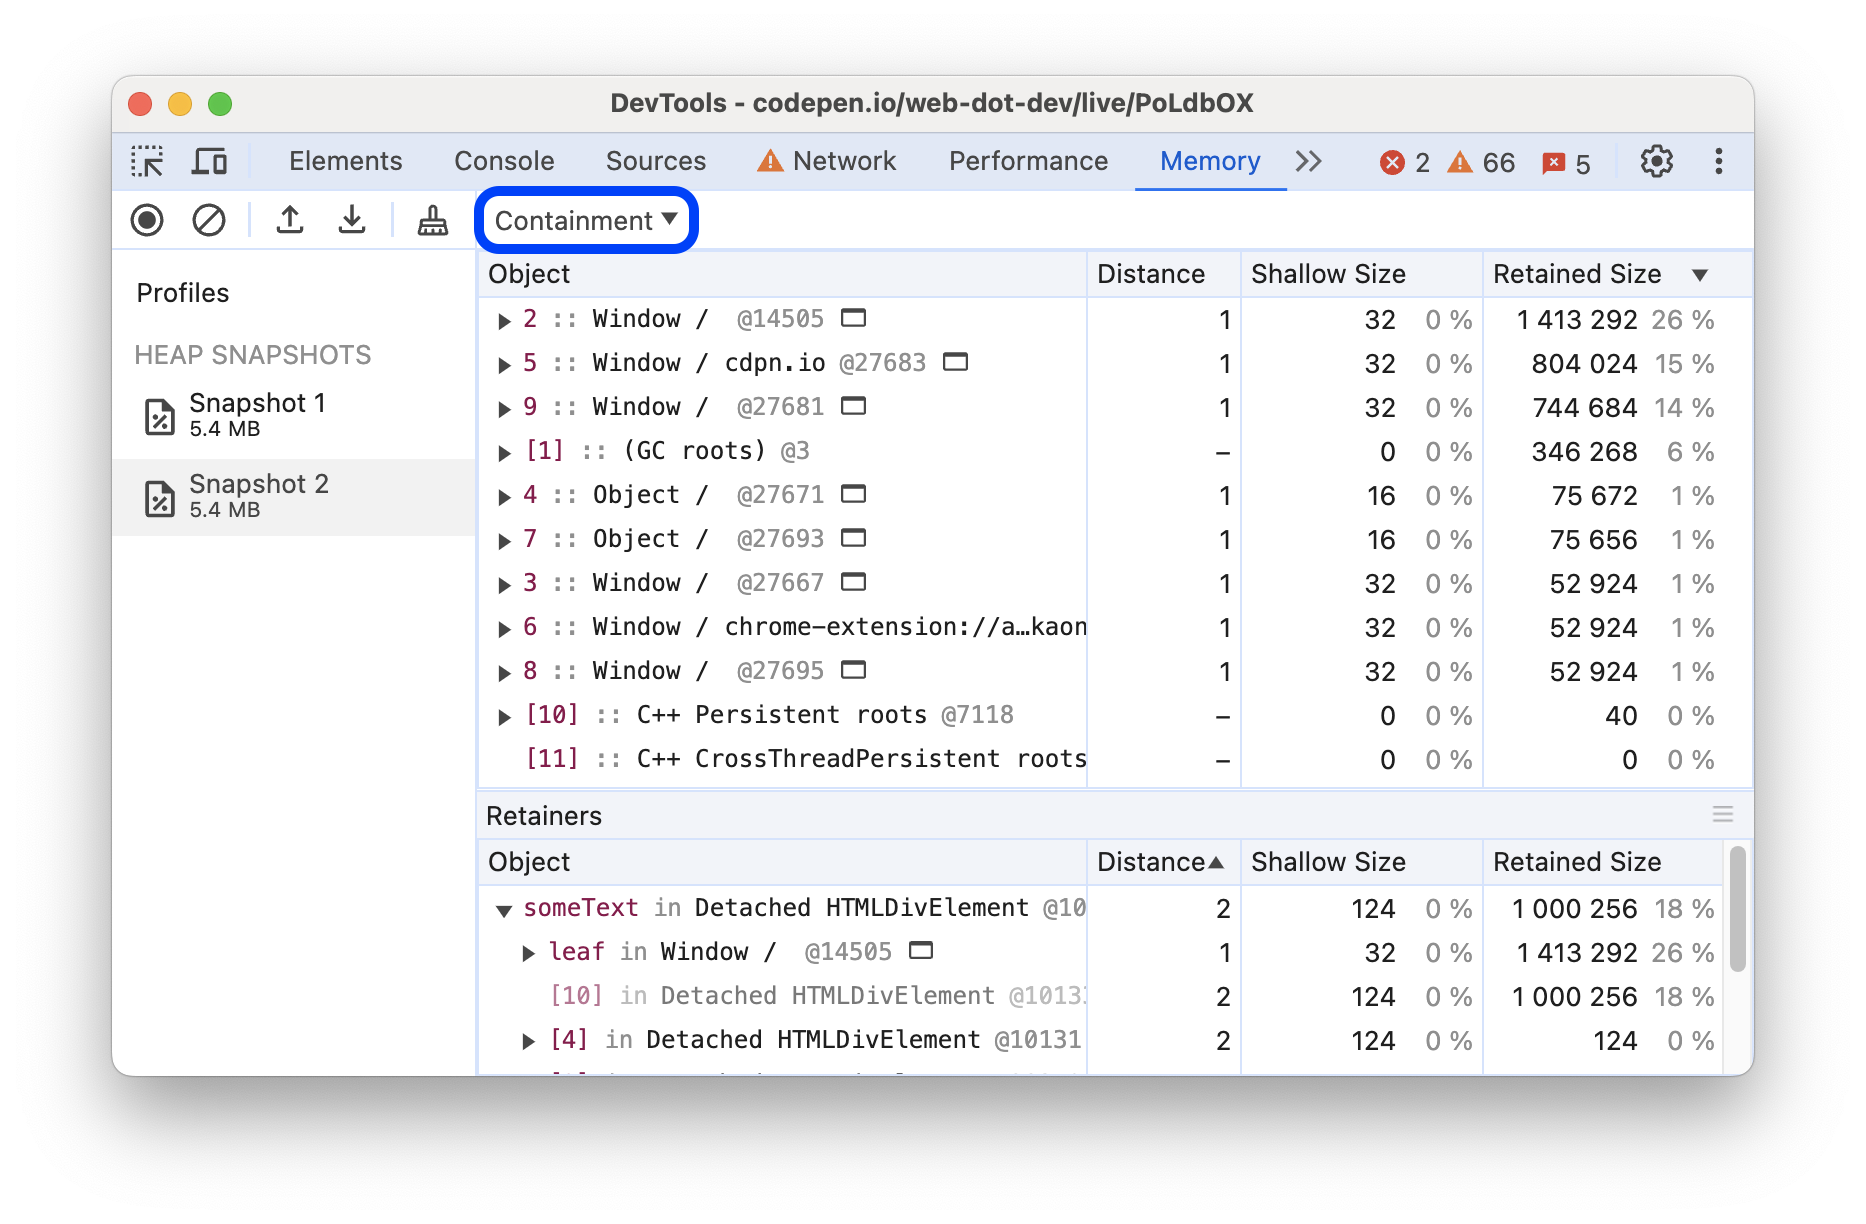
The Containment view is a "bird's eye view" of your application's objects structure. It lets you peek inside function closures, observe VM internal objects that together make up your JavaScript objects, and to understand how much memory your application uses at a very low level.
The view provides several entry points:
- DOMWindow objects. Global objects for JavaScript code.
- GC roots. GC roots used by the VM's garbage collector. GC roots can consist of built-in object maps, symbol tables, VM thread stacks, compilation caches, handle scopes, and global handles.
- Native objects. Browser objects "pushed" inside the JavaScript virtual machine to allow automation, for example, DOM nodes and CSS rules.
The Retainers section
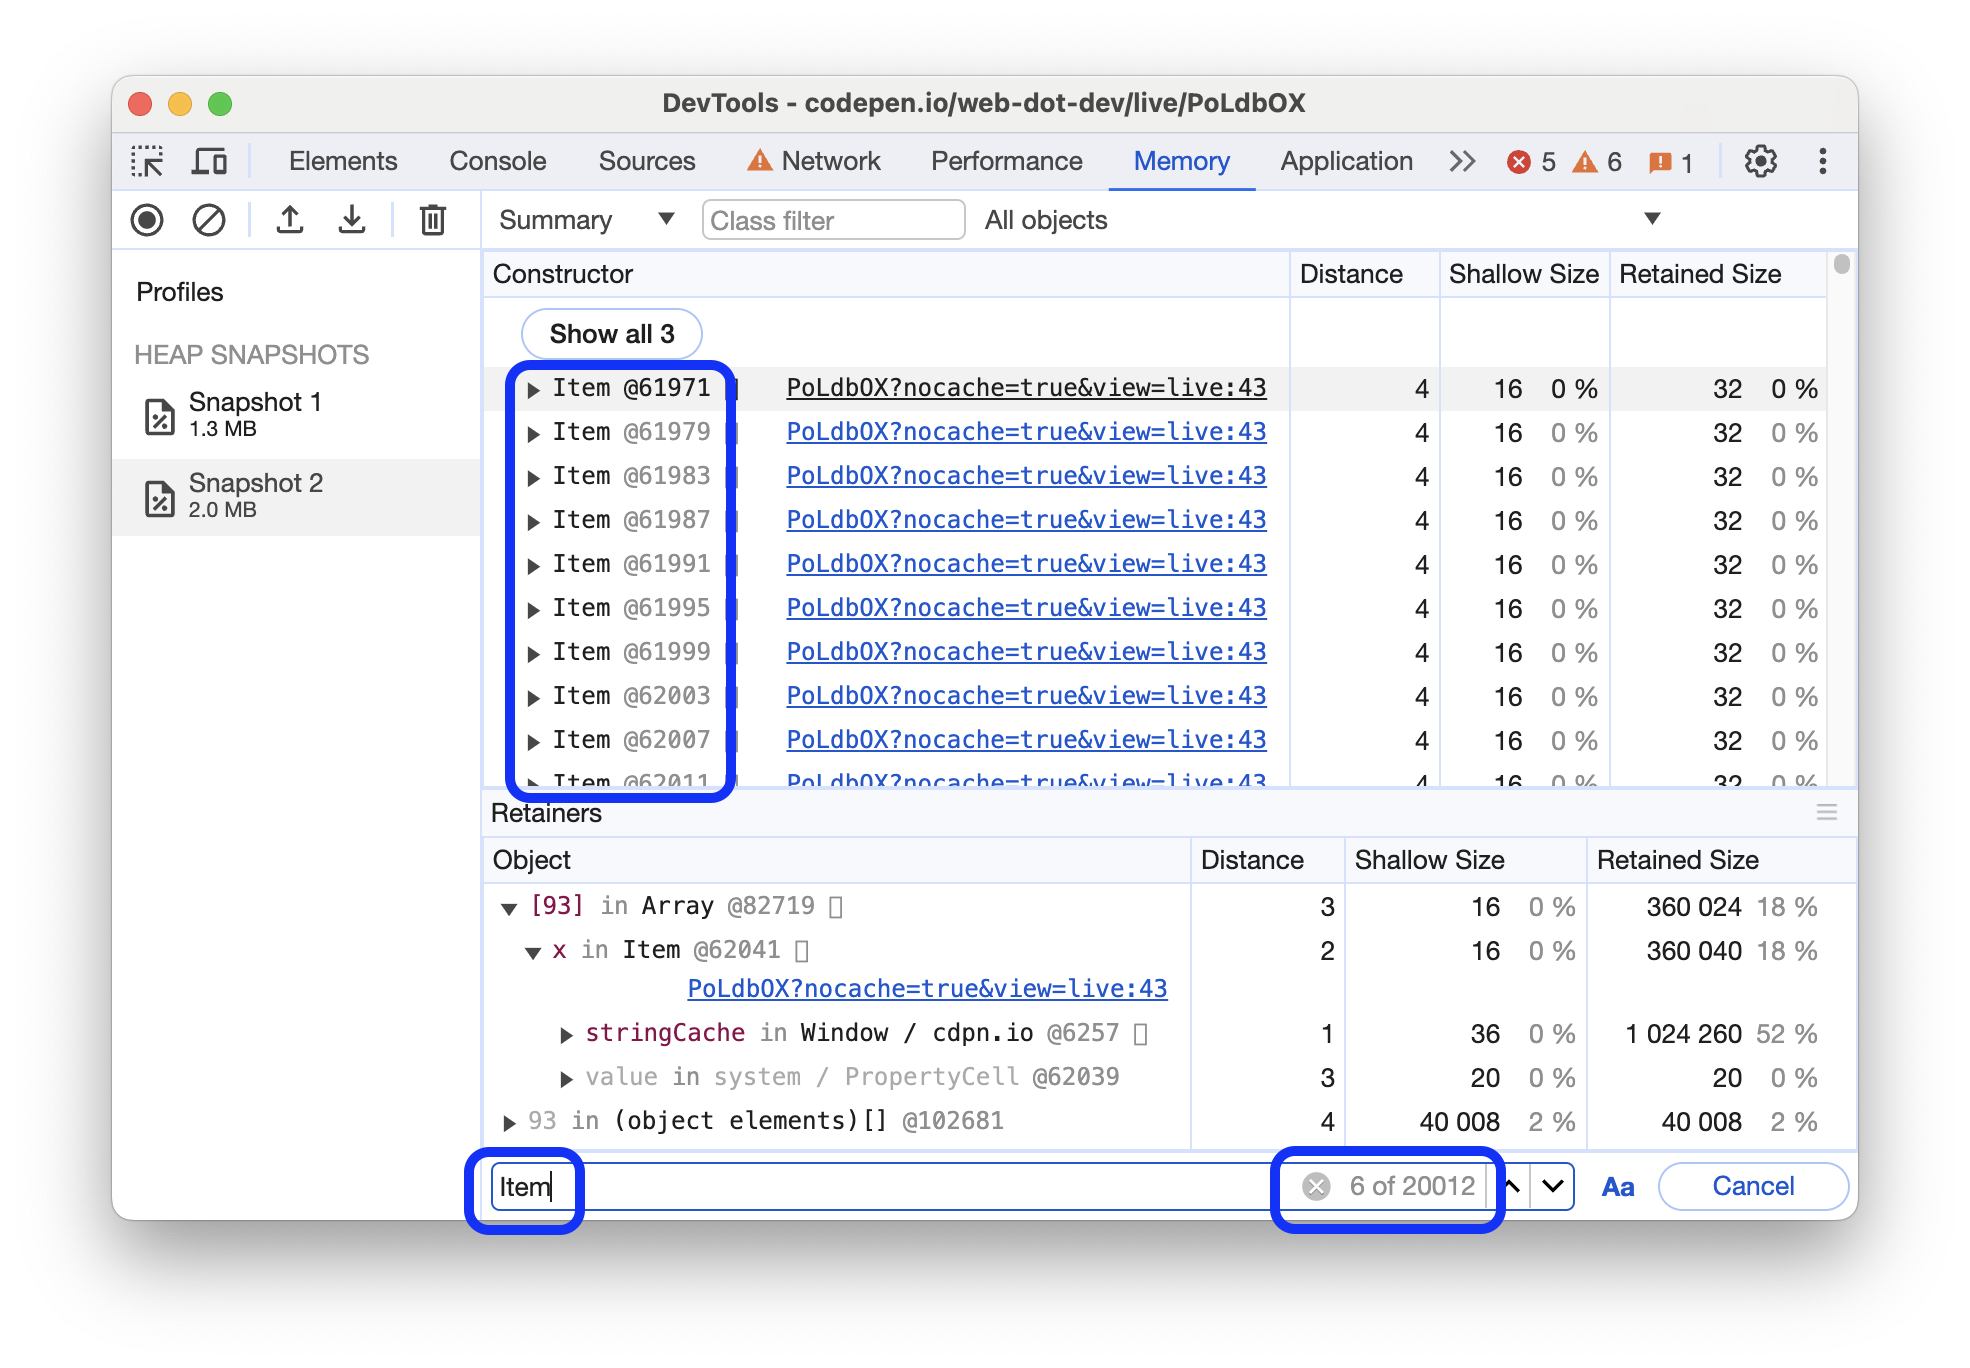
The Retainers section at the bottom of the Memory panel shows objects that point to the object selected in the view. The Memory panel updates the Retainers section when you select a different objects in any of the views except Statistics.
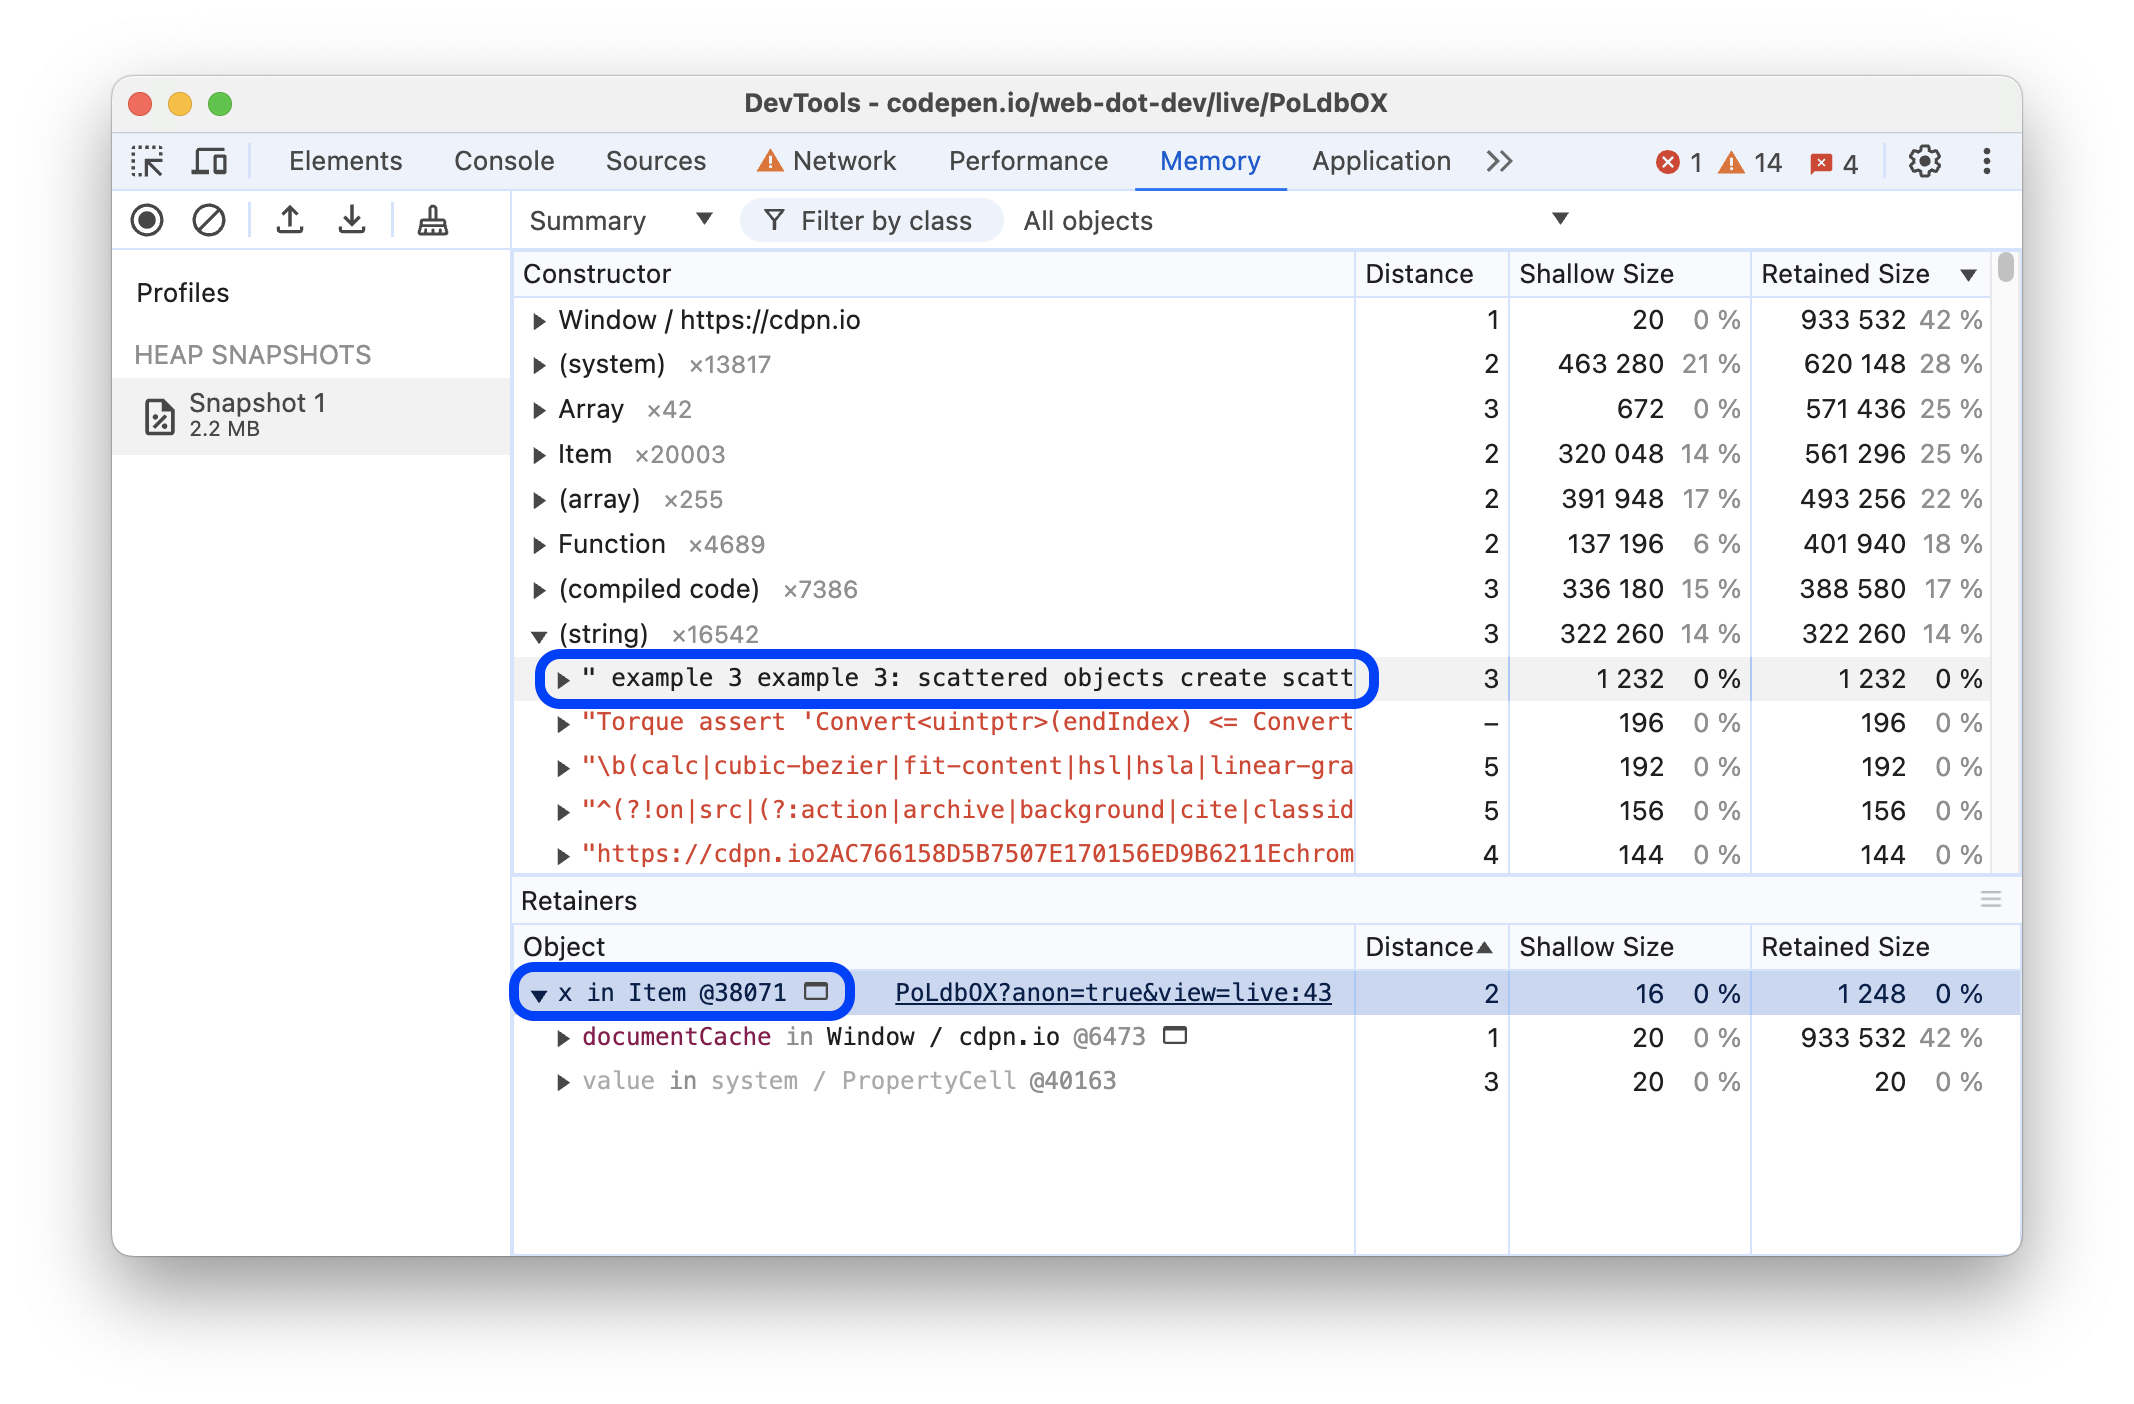
In this example, the selected string is retained by the x property of an Item instance.
Ignore retainers
You can hide retainers to find out of any other objects retain the selected one. With this option, you don't have to first remove this retainer from the code and then retake the heap snapshot.
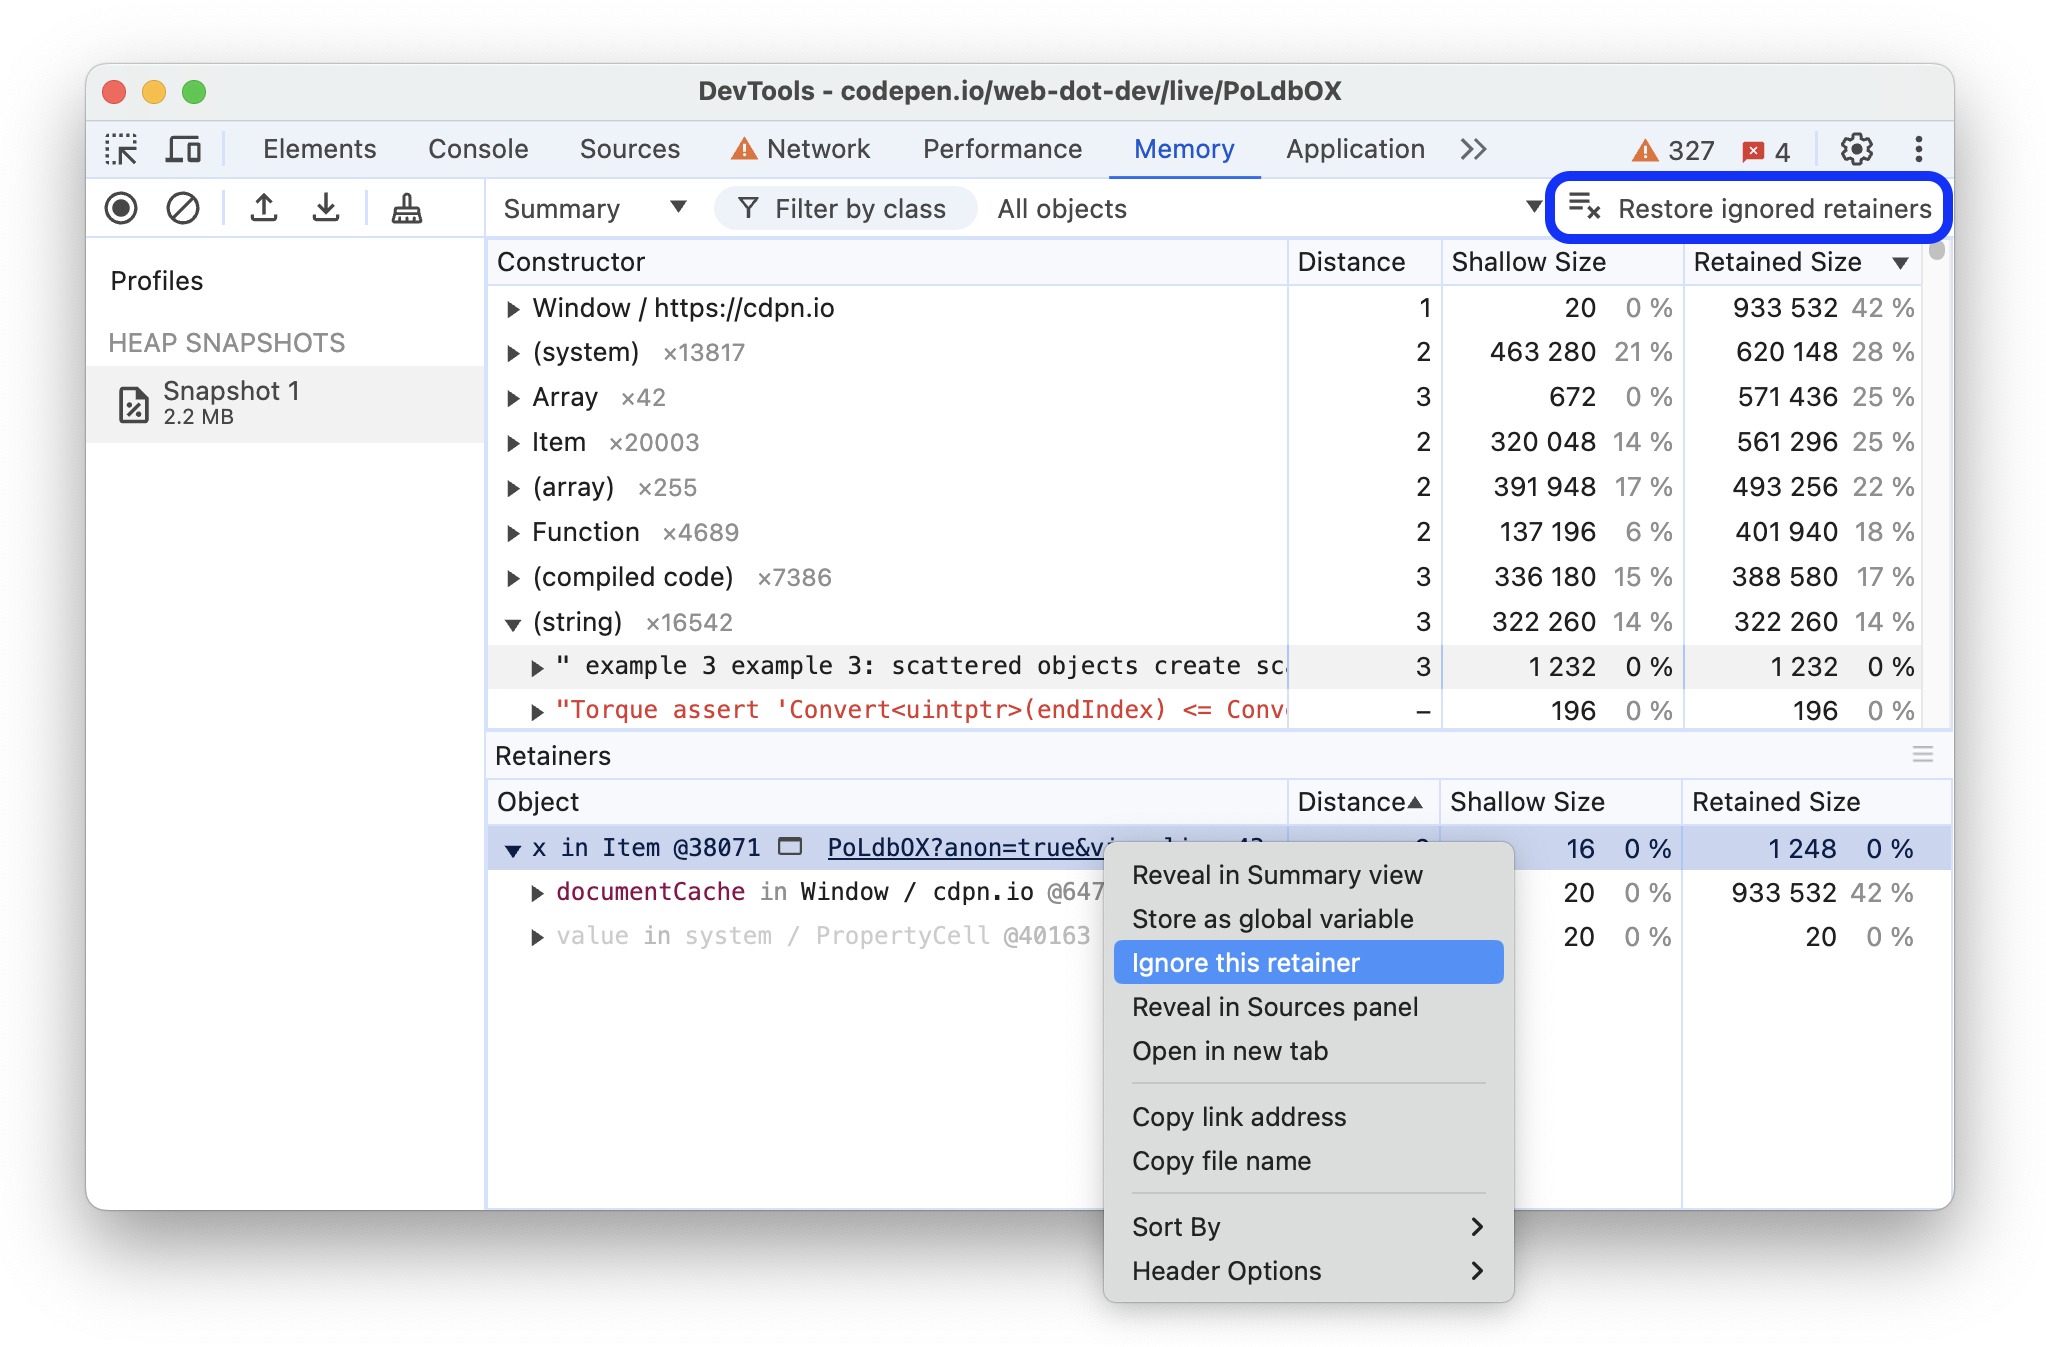
To hide a retainer, right-click and select Ignore this retainer. Ignored retainers are marked as ignored in the Distance column. To stop ignoring all retainers, click Restore ignored retainers in the action bar at the top.
Find a specific object
To find an object in the collected heap you can search using Ctrl + F and enter the object ID.
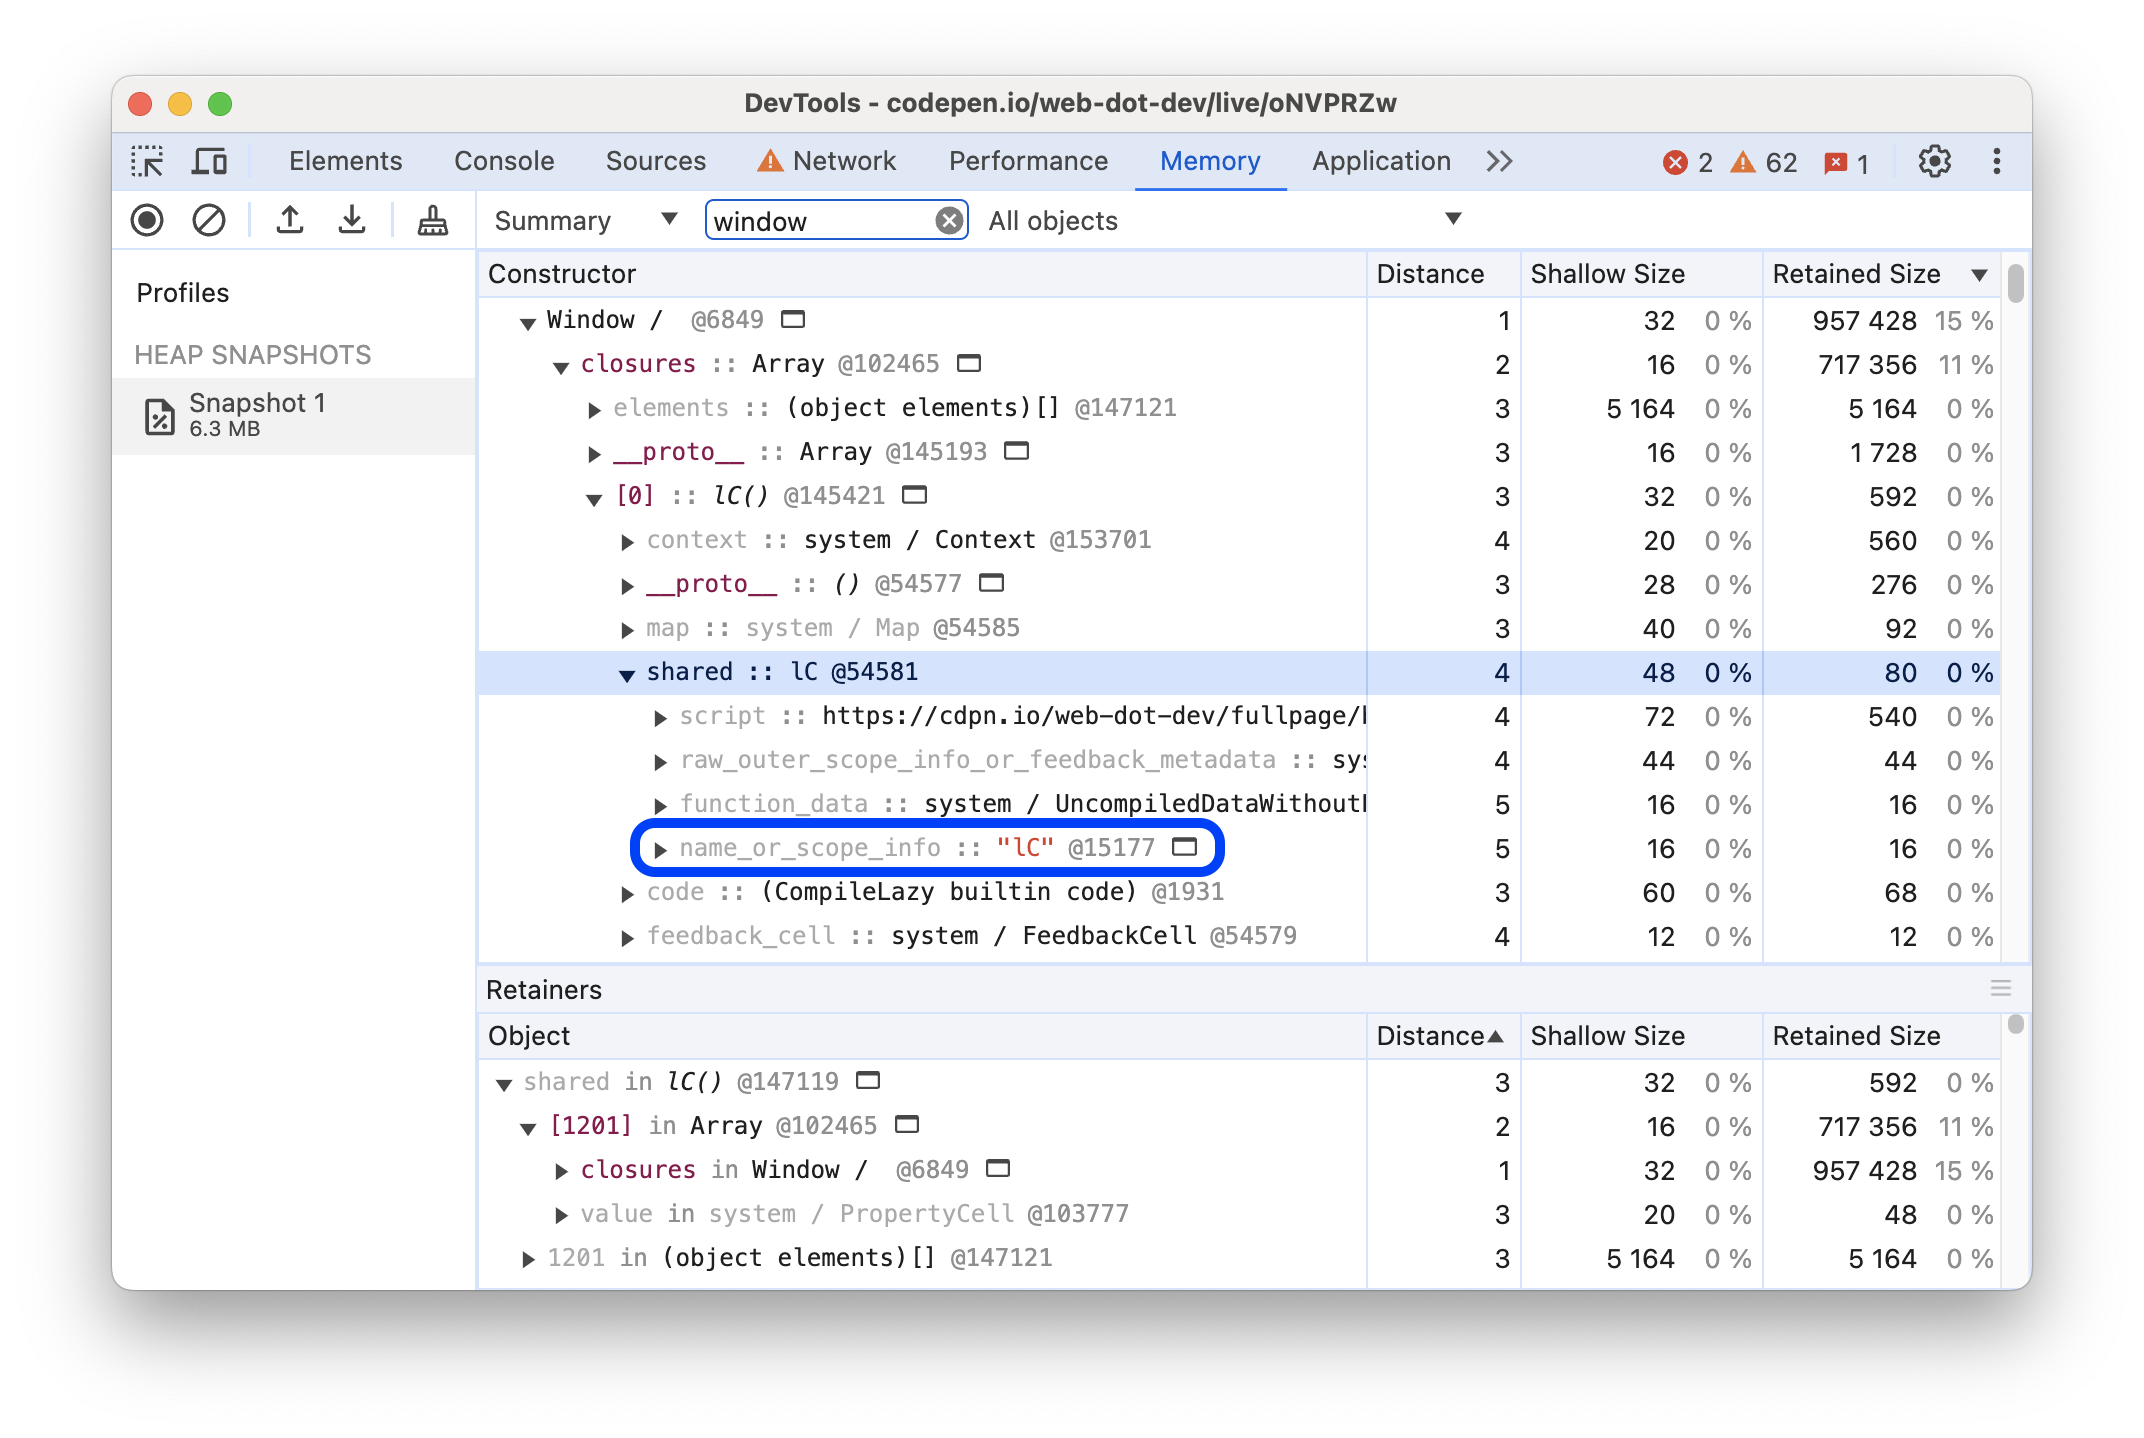
Name functions to distinguish closures
It helps a lot to name the functions so you can distinguish between closures in the snapshot.
For example, the following code doesn't use named functions:
function createLargeClosure() {
  var largeStr = new Array(1000000).join('x');

  var lC = function() { // this is NOT a named function
    return largeStr;
  };

  return lC;
}
Whilst this example does:
function createLargeClosure() {
  var largeStr = new Array(1000000).join('x');

  var lC = function lC() { // this IS a named function
    return largeStr;
  };

  return lC;
}
Uncover DOM leaks
The heap profiler has the ability to reflect bidirectional dependencies between browser-native objects (DOM nodes and CSS rules) and JavaScript objects. This helps discover otherwise invisible leaks happening due to forgotten detached DOM subtrees floating around.
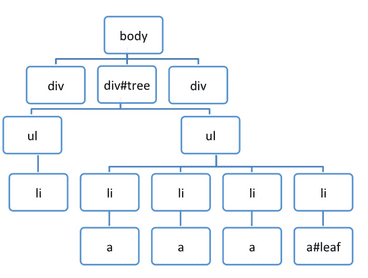
DOM leaks can be bigger than you think. Consider the following example. When is the #tree garbage collected?
  var select = document.querySelector;
  var treeRef = select("#tree");
  var leafRef = select("#leaf");
  var body = select("body");

  body.removeChild(treeRef);

  //#tree can't be GC yet due to treeRef
  treeRef = null;

  //#tree can't be GC yet due to indirect
  //reference from leafRef

  leafRef = null;
  //#NOW #tree can be garbage collected
#leaf maintains a reference to its parent (parentNode) and recursively up to #tree, so only
when leafRef is nullified is the whole tree under #tree a candidate for GC.
