

Published: May 5, 2026
Chrome 148 makes the full-page accessibility tree the default, introduces ad provenance details in tooltips, improves debugging for Speculation Rules, and adds new diagnostic views for crash reports.
DevTools for agents
The Chrome DevTools MCP server and CLI have been updated to version 0.24.0, with several new features. This release also includes various reliability fixes, such as automatic handling of browser dialogs to prevent script interruptions during tool execution.
Key features added since the last update include:
- Chrome Extension debugging: Agents can now target and debug Chrome extensions, allowing them to inspect extension-specific pages and background scripts directly.
- WebMCP tool calling: New experimental tools enable agents to list and execute WebMCP tools exposed by web pages.
- Agentic browsing in Lighthouse: A new "Agentic Browsing" audit category evaluates whether a site is optimized for the agentic web, such as by validating WebMCP tool registrations.
To start using these and more features, check out the GitHub repository with detailed release notes.
Full accessibility tree by default
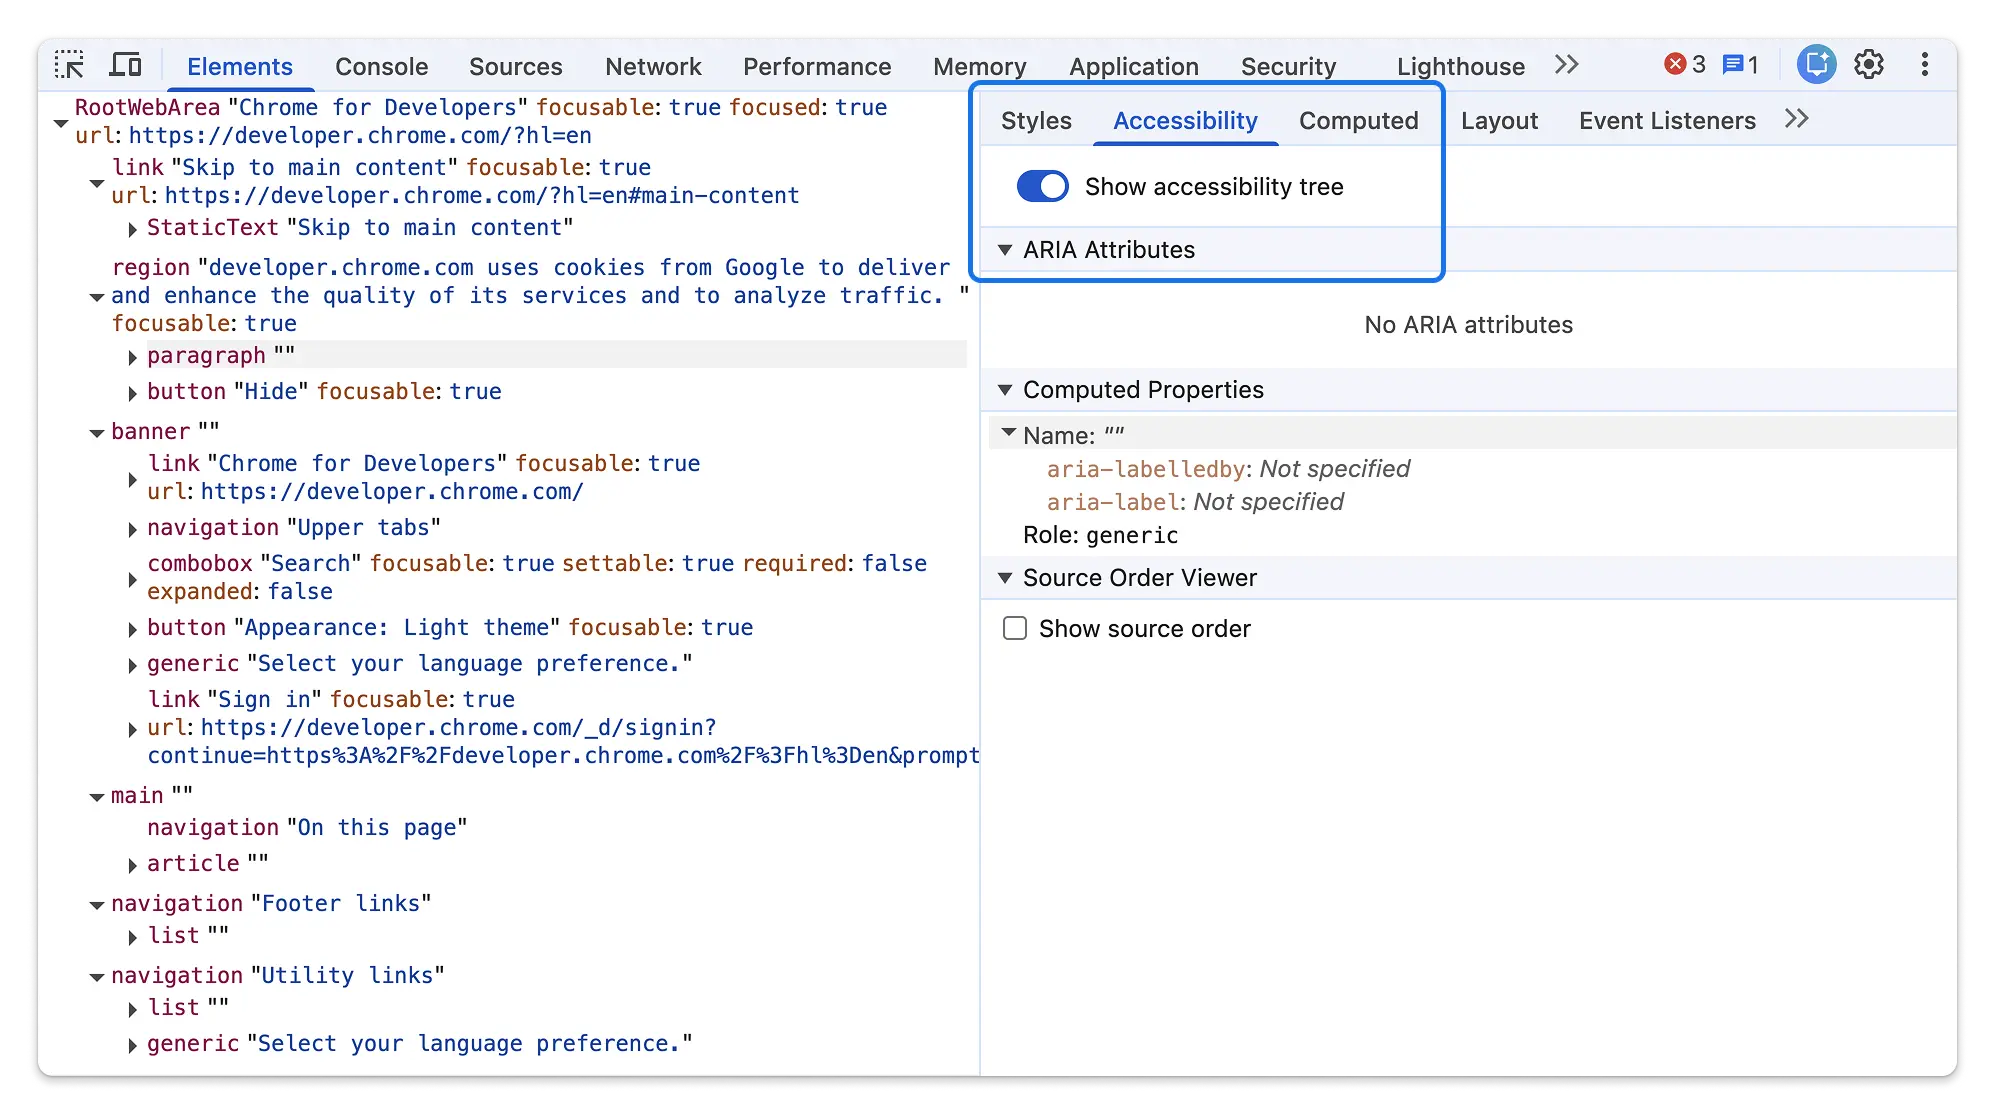
The full accessibility tree is officially leaving its experimental phase and remains the default view in the Elements panel. With this transition, the legacy breadcrumb-style accessibility tree has been removed from source in favor of this more comprehensive view.
To streamline the interface, Chrome 148 removes the floating action button previously used to toggle between the DOM and accessibility trees. You can now switch views using a dedicated toggle located within the Accessibility tab in the sidebar.
Chromium issues: 40808541
Speculative loads enhancements
The Speculative loads section got more powerful for debugging preloading:
- Text Filtering: You can now filter the list of rules and attempts using
free text or keyed filters (e.g.,
url:,status:). - HTTP Status Codes: For failed attempts, the actual HTTP status code (like 404 or 503) is now displayed directly in the grid.
- Form Submissions: The panel now explicitly identifies and displays
form_submissionas a trigger for preloading.
Chromium issues: 479524246, 40926909
This was a community contribution, thanks to @hjanuschka!
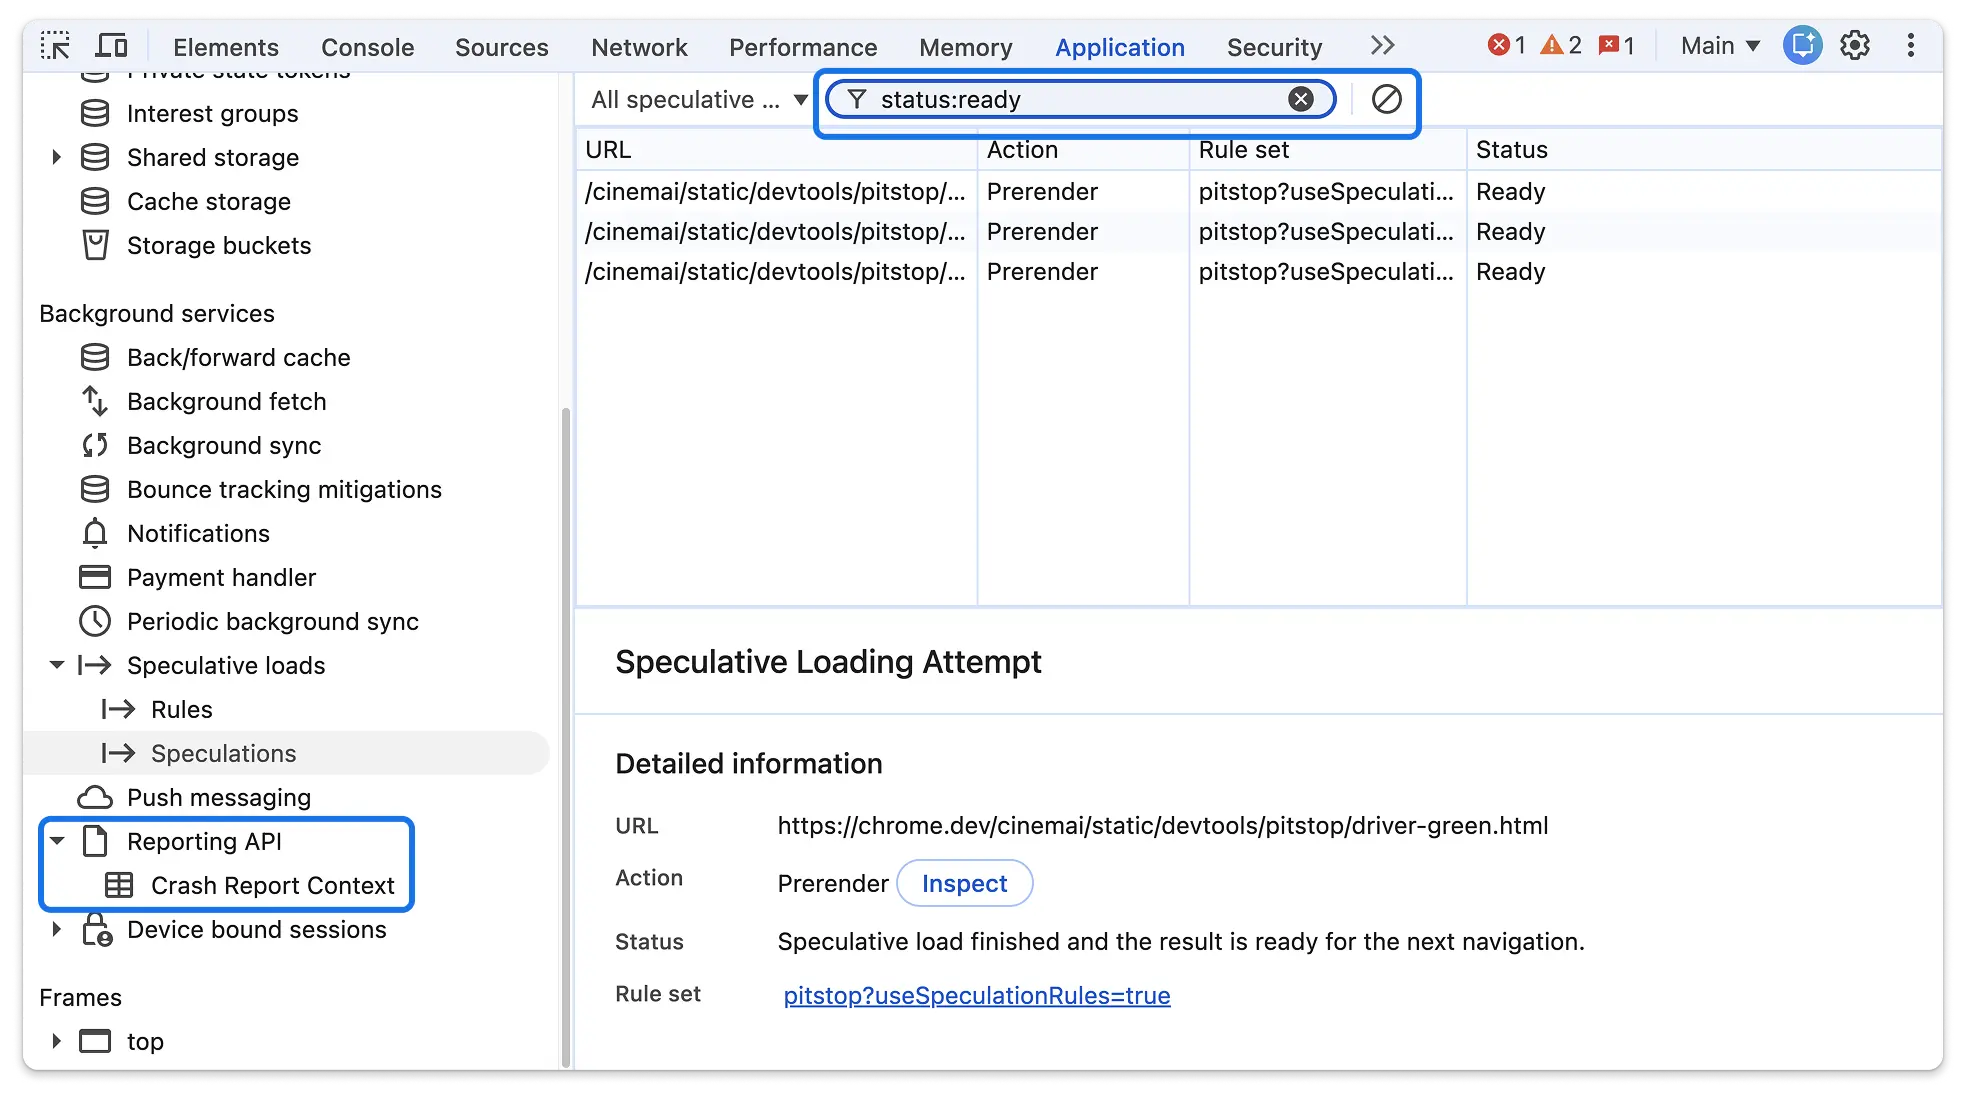
Crash report context
A new Crash reports section in the Application panel sidebar lets you inspect crash reports generated by the browser. For each report, DevTools now displays a detailed Context grid containing key-value attributes related to the crash, making it easier to correlate crashes with specific frame states or configurations.
Chromium issues: 400432195
Name-only @container queries
DevTools now supports name-only @container queries. Previously, queries
without a descriptor (like @container sidebar) might not be properly reflected
in the Styles tab. They are now correctly rendered and linkable in the style
properties section.
Collapsed non-contributing sections
To reduce clutter, the Styles tab now automatically collapses sections that don't contribute any active declarations. Rules that are empty or contain only overloaded properties (overridden by other rules) will be collapsed by default, while sections with disabled properties remain expanded for easier debugging.
Chromium issues: 40287550, 351662727
Request order and recommended throttling
- Request # Column: You can now add an optional Request # column to the Network panel. This column displays the absolute order in which requests were initiated and supports sorting.
- Recommended Throttling: The Network panel's throttling drop-down now highlights recommended presets based on real-world field data (CrUX) from your site's users, aligning it with the recommendations already found in the Performance panel.
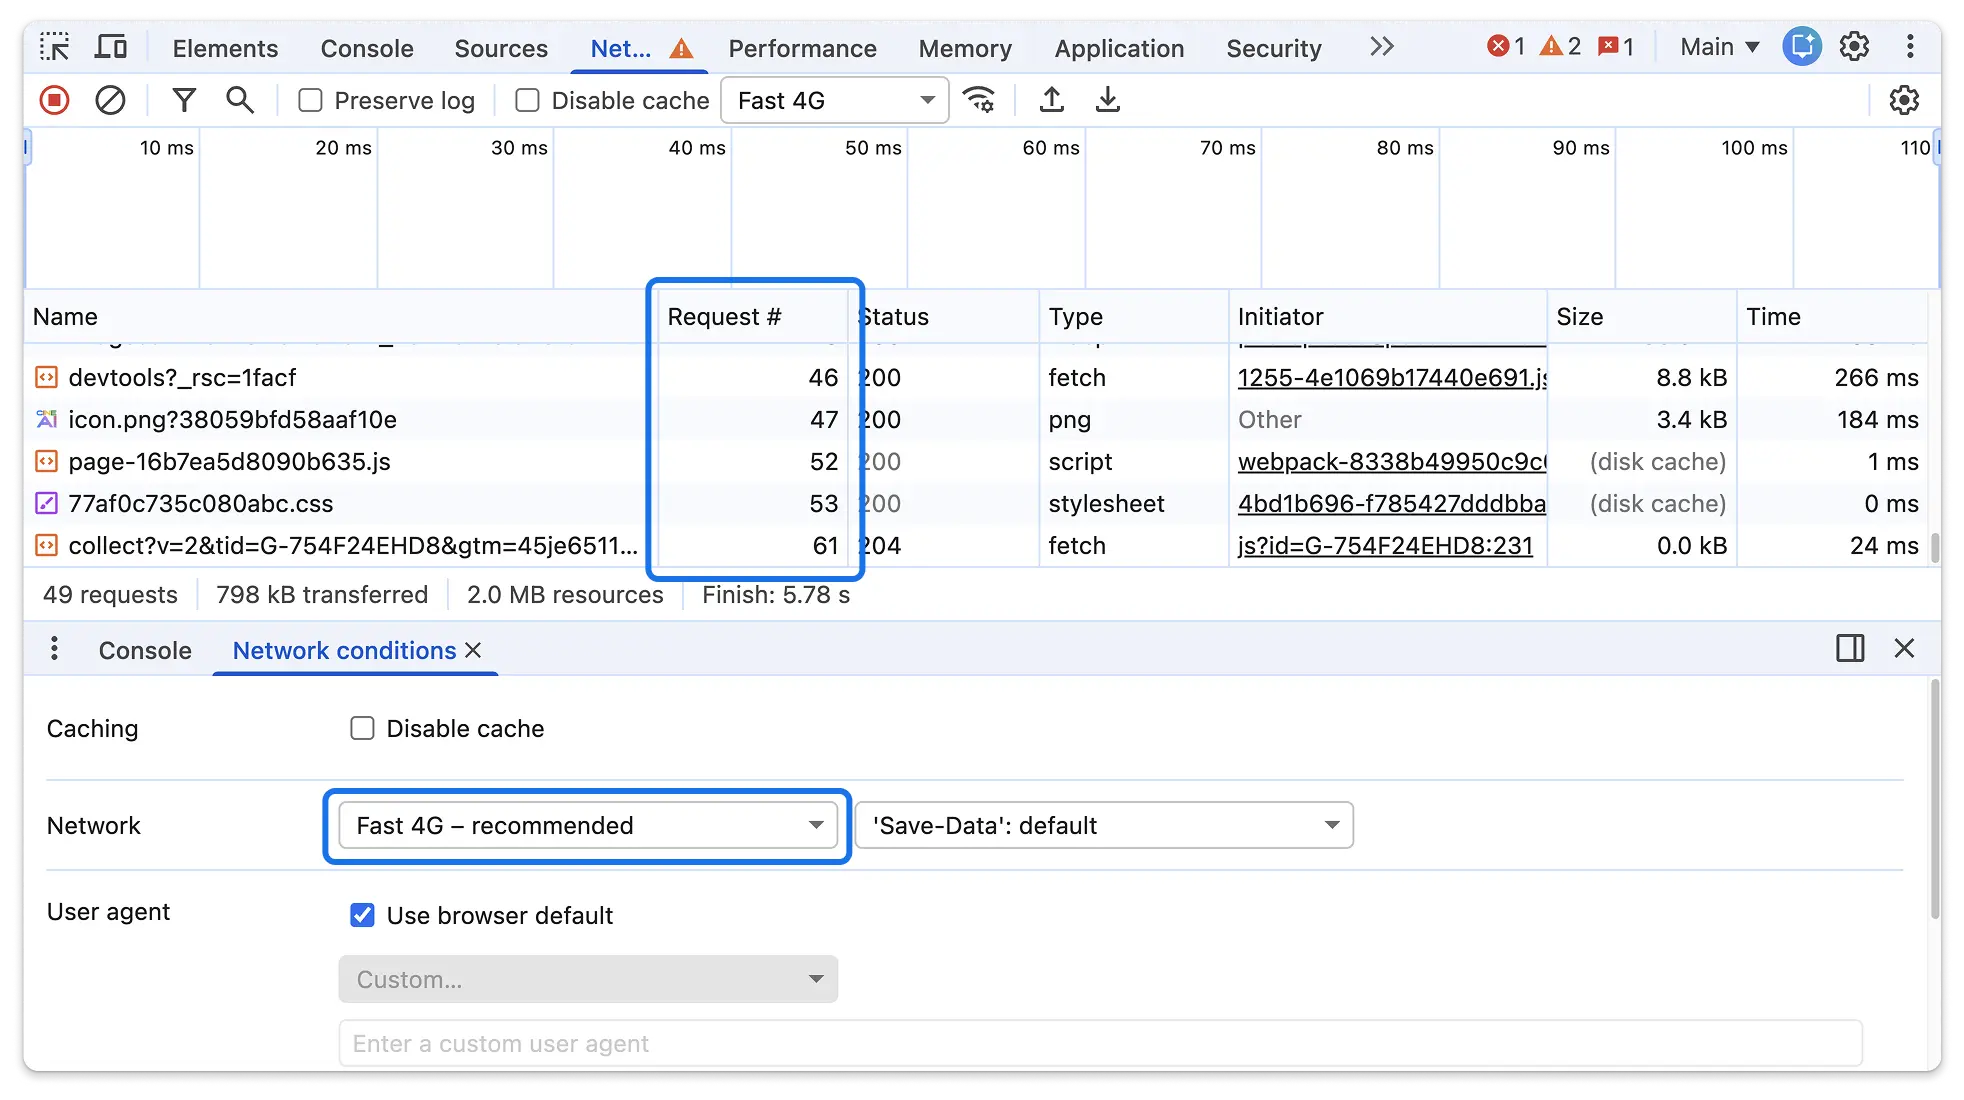
Chromium issues: 40276422, 456383409
Ad provenance in adorners
DevTools now provides more transparency into why elements are tagged as ads. When you hover over an ad adorner in the Elements panel, a new tooltip shows the ad provenance.
The tooltip provides context on why the element was identified as an ad, such as:
- Script ancestry: Which scripts were involved in creating the element.
- Filter list rules: The specific rule from a filter list (e.g., EasyList) that matched the element or the resource it loaded.
This helps developers and privacy researchers understand the "why" behind ad tagging and helps in debugging false positives.
Chromium issues: 490029725, 495842556
Miscellaneous highlights
- Emulation: Fixed a long-standing bug where taking full-page screenshots would occasionally leave the viewport in a "leaked" or broken state (495385035).
- WebAuthn: Added support for testing
hmac-secretandhmac-secret-mcextensions with virtual authenticators (420689820). - Memory: Improved feedback when manually triggering garbage collection with a new snackbar notification (493708151).
- Object Inspection: Removed the
show-option-to-expose-internals-in-heap-snapshotexperiment; the checkbox is now shown by default (497855658).