Introduction
Today, authors can use many abstractions to build their Web applications. Instead of directly interfacing with the lower-level APIs that the Web Platform provides, many authors leverage frameworks, build tools and compilers to write their applications from a higher-level perspective.
For example, components built on top of the Angular framework are authored in TypeScript with HTML templates. Underneath the hood, the Angular CLI and webpack compile everything to JavaScript and into a so-called bundle, which is then shipped to the browser.
When debugging or profiling Web applications in DevTools, you currently get to see and debug this compiled version of your code instead of the code you actually wrote. As an author, this is not want you want, though:
- You don’t want to debug minified JavaScript code, you want to debug your original JavaScript code.
- When using TypeScript, you don’t want to debug JavaScript, you want to debug your original TypeScript code.
- When you use templating like with Angular, Lit, or JSX, you don’t always want to debug the resulting DOM. You might want to debug the components themselves.
Overall, you likely want to debug your own code as you wrote it.
While source maps already close this gap to some extent, there is more that Chrome DevTools and the ecosystem can do in this area.
Let’s take a look!
Authored versus Deployed Code
Currently, when navigating the file tree in the Sources Panel, you get to see the contents of the compiled—and often minified—bundle. These are the actual files that the browser downloads and runs. DevTools calls this the Deployed Code.
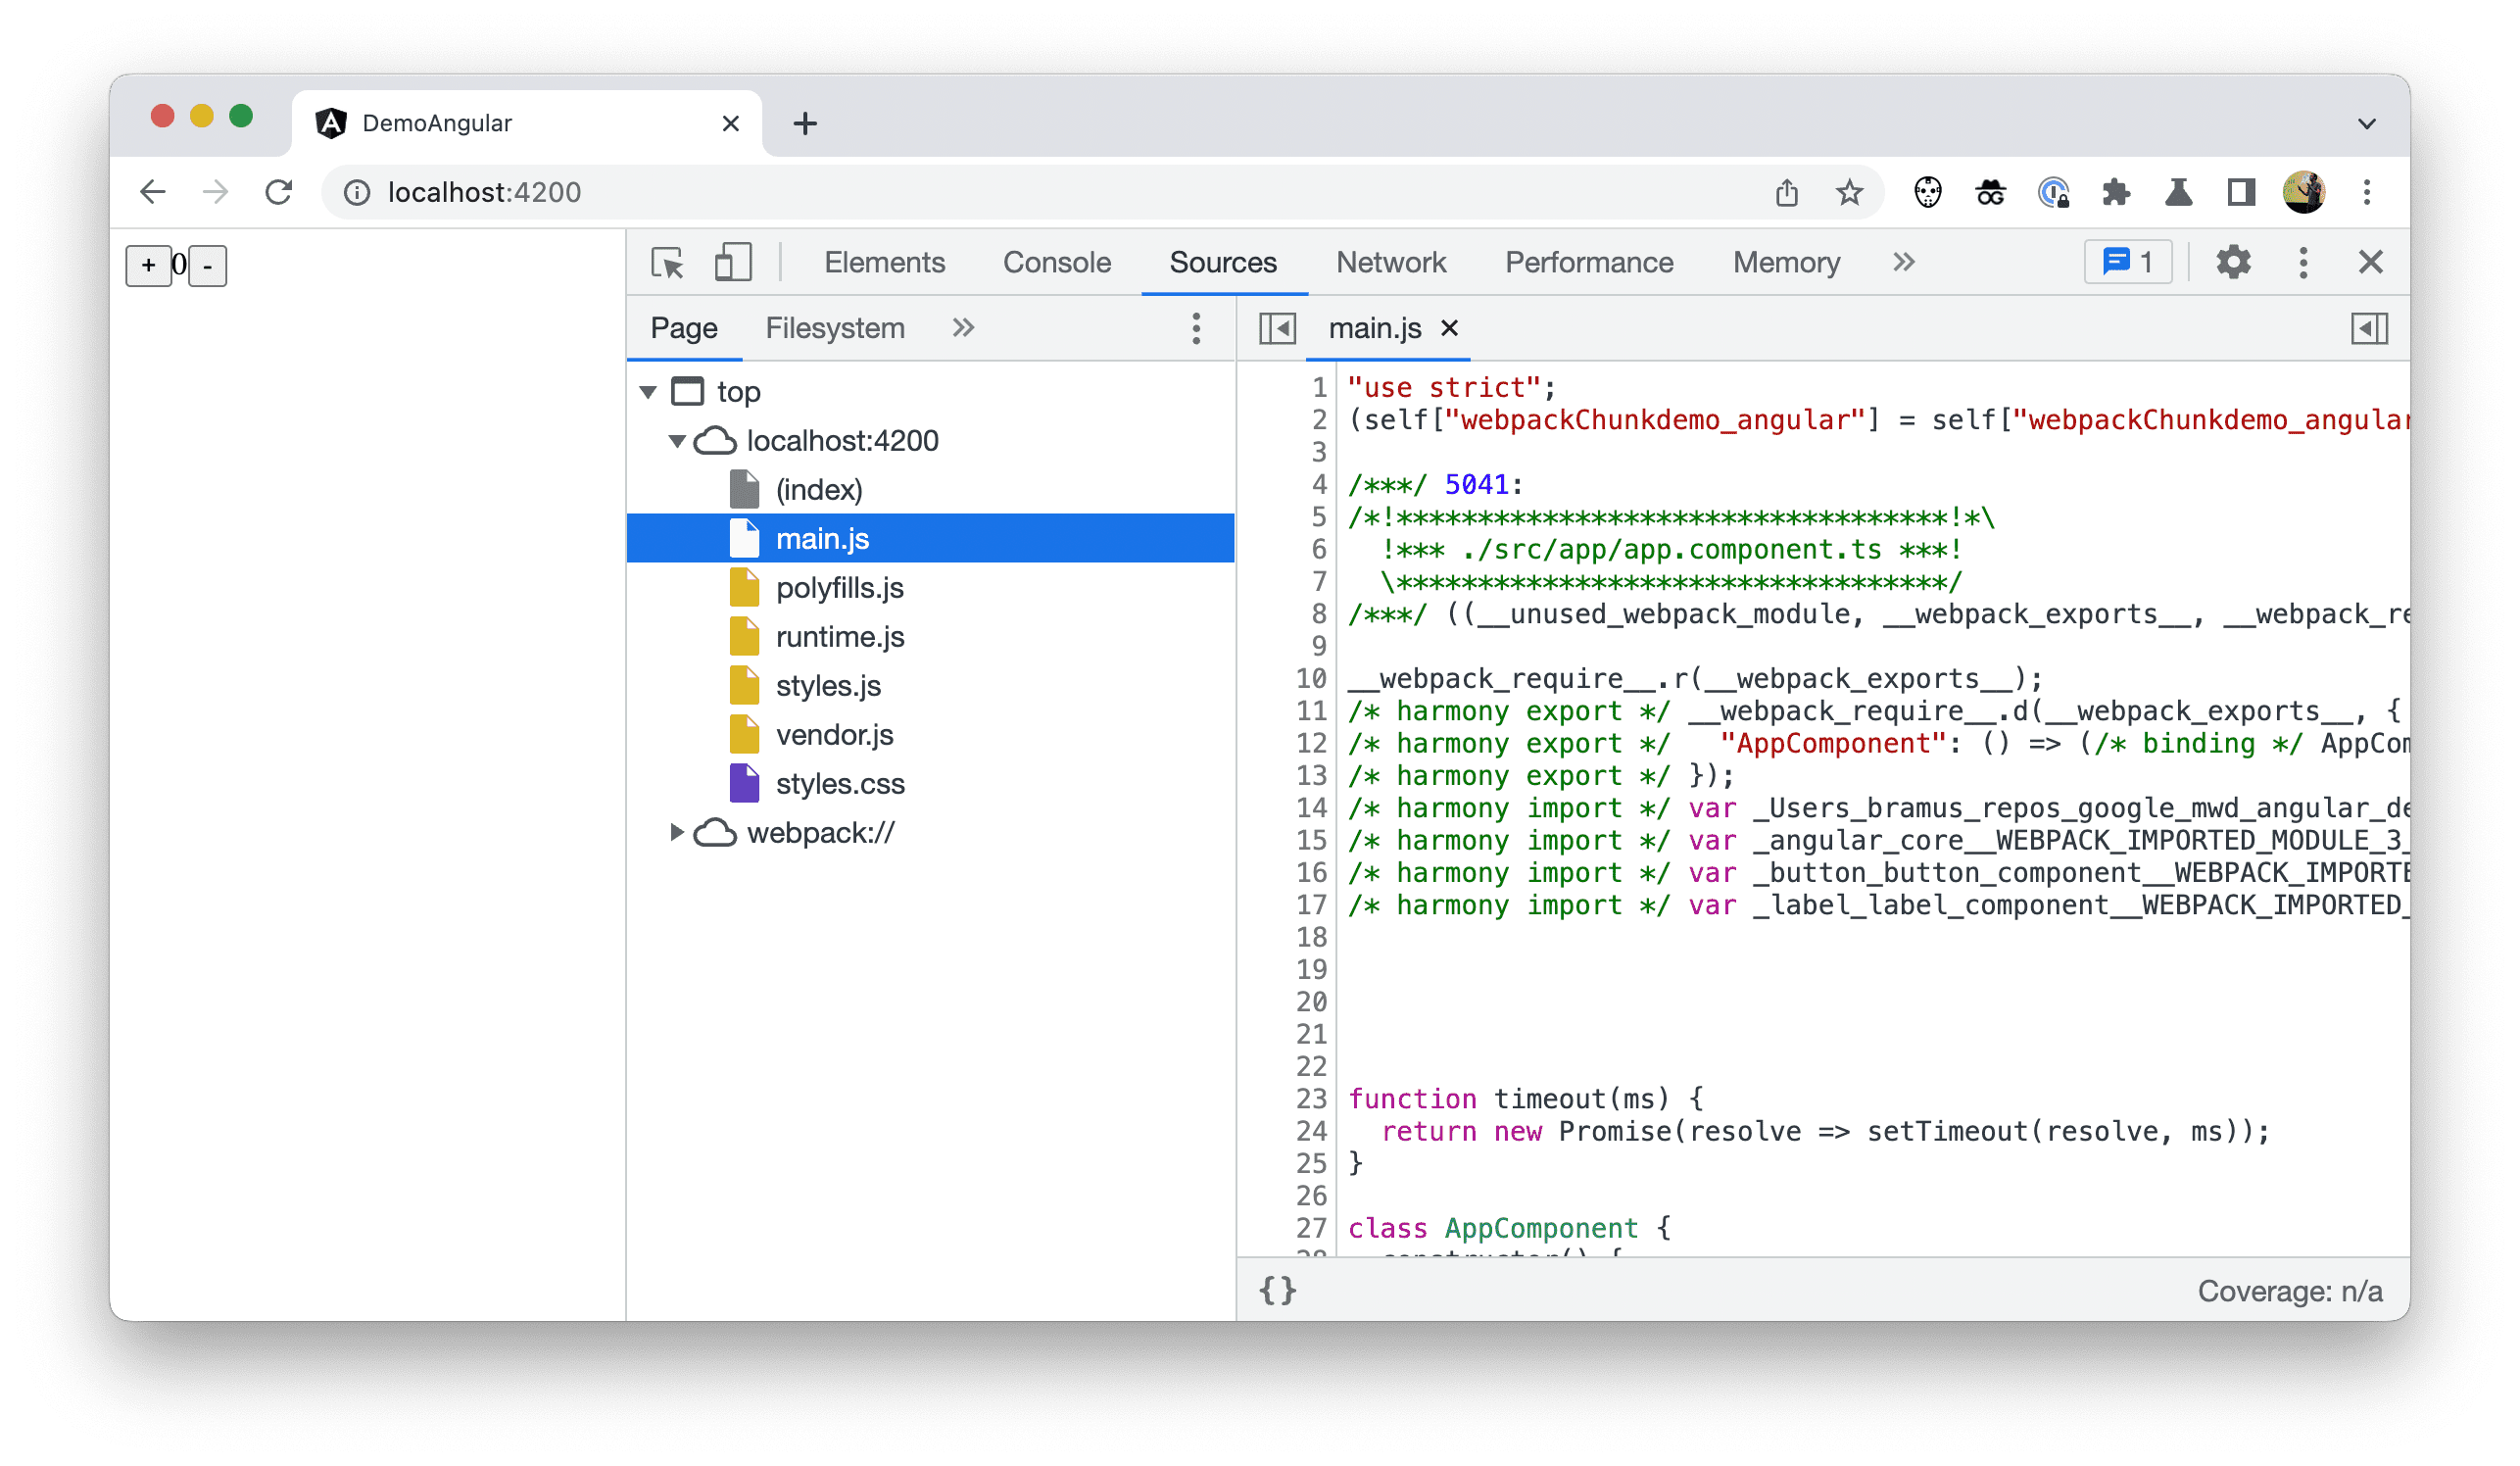
This is not very handy and often hard to grasp. As an author, you want to see and debug the code that you wrote, not the Deployed Code.
To make up for it, you can now have the tree show the Authored Code instead. This makes the tree more closely resemble source files you get to see in your IDE, and these files are now separated from the Deployed Code.
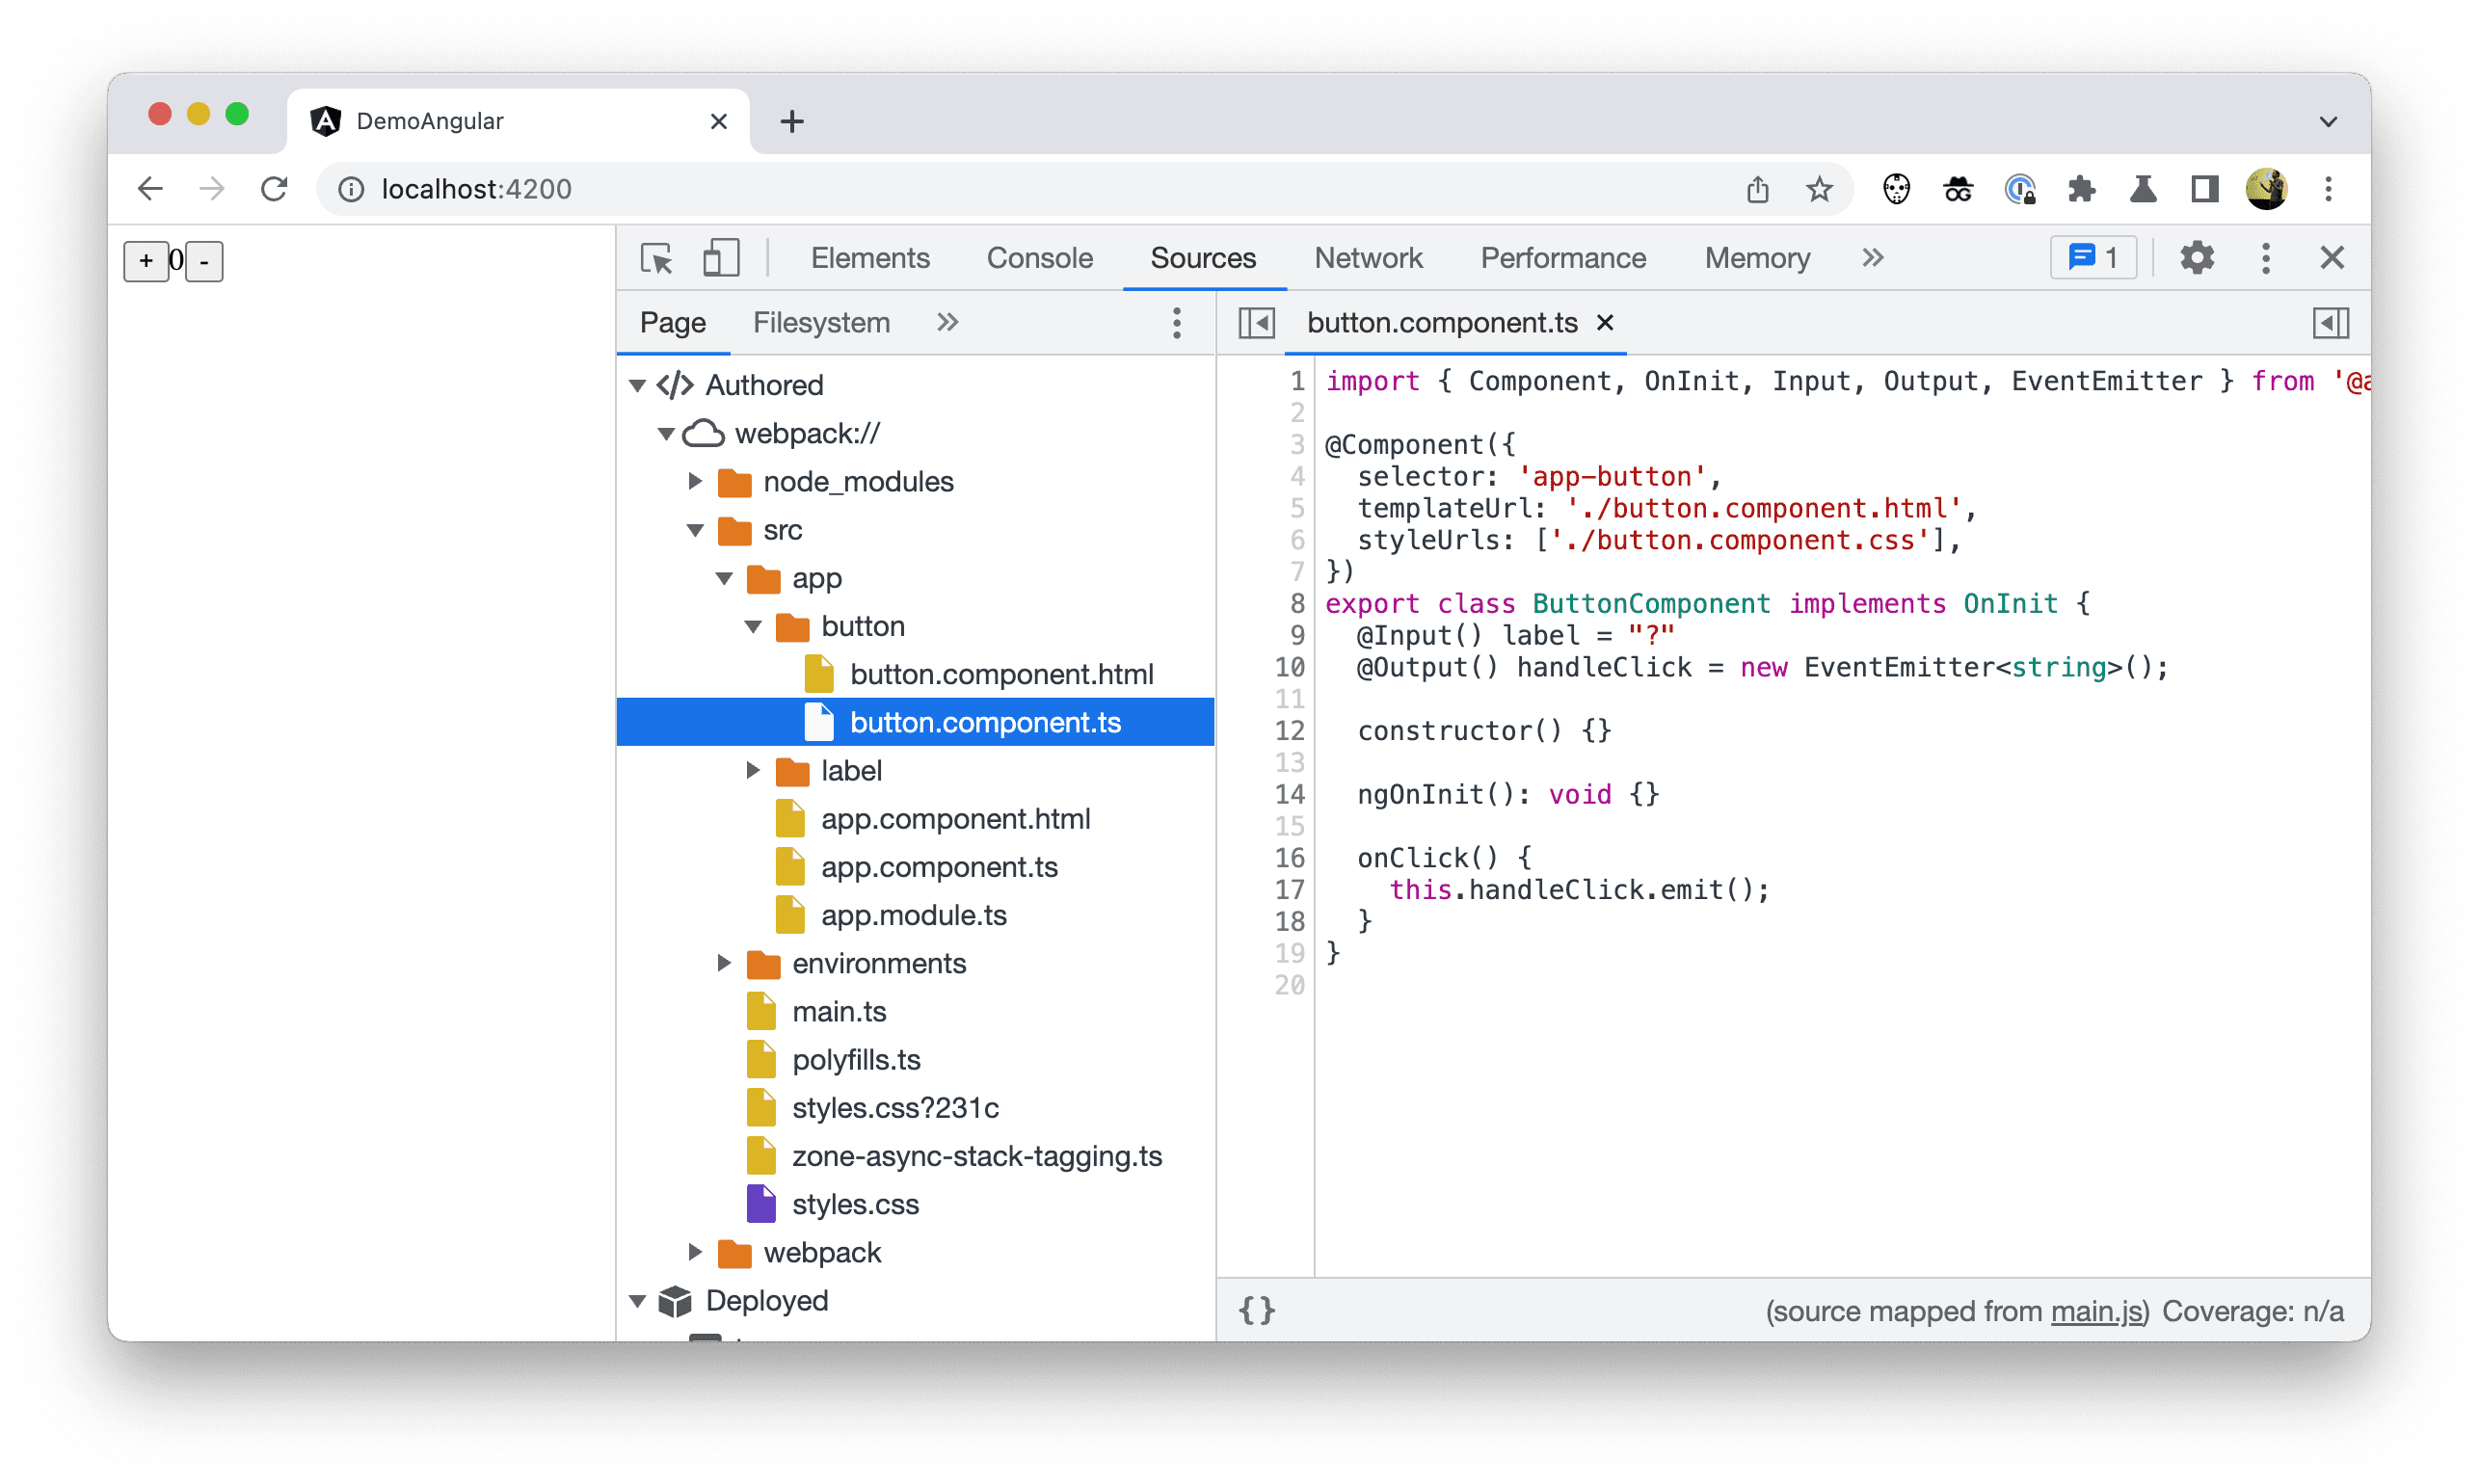
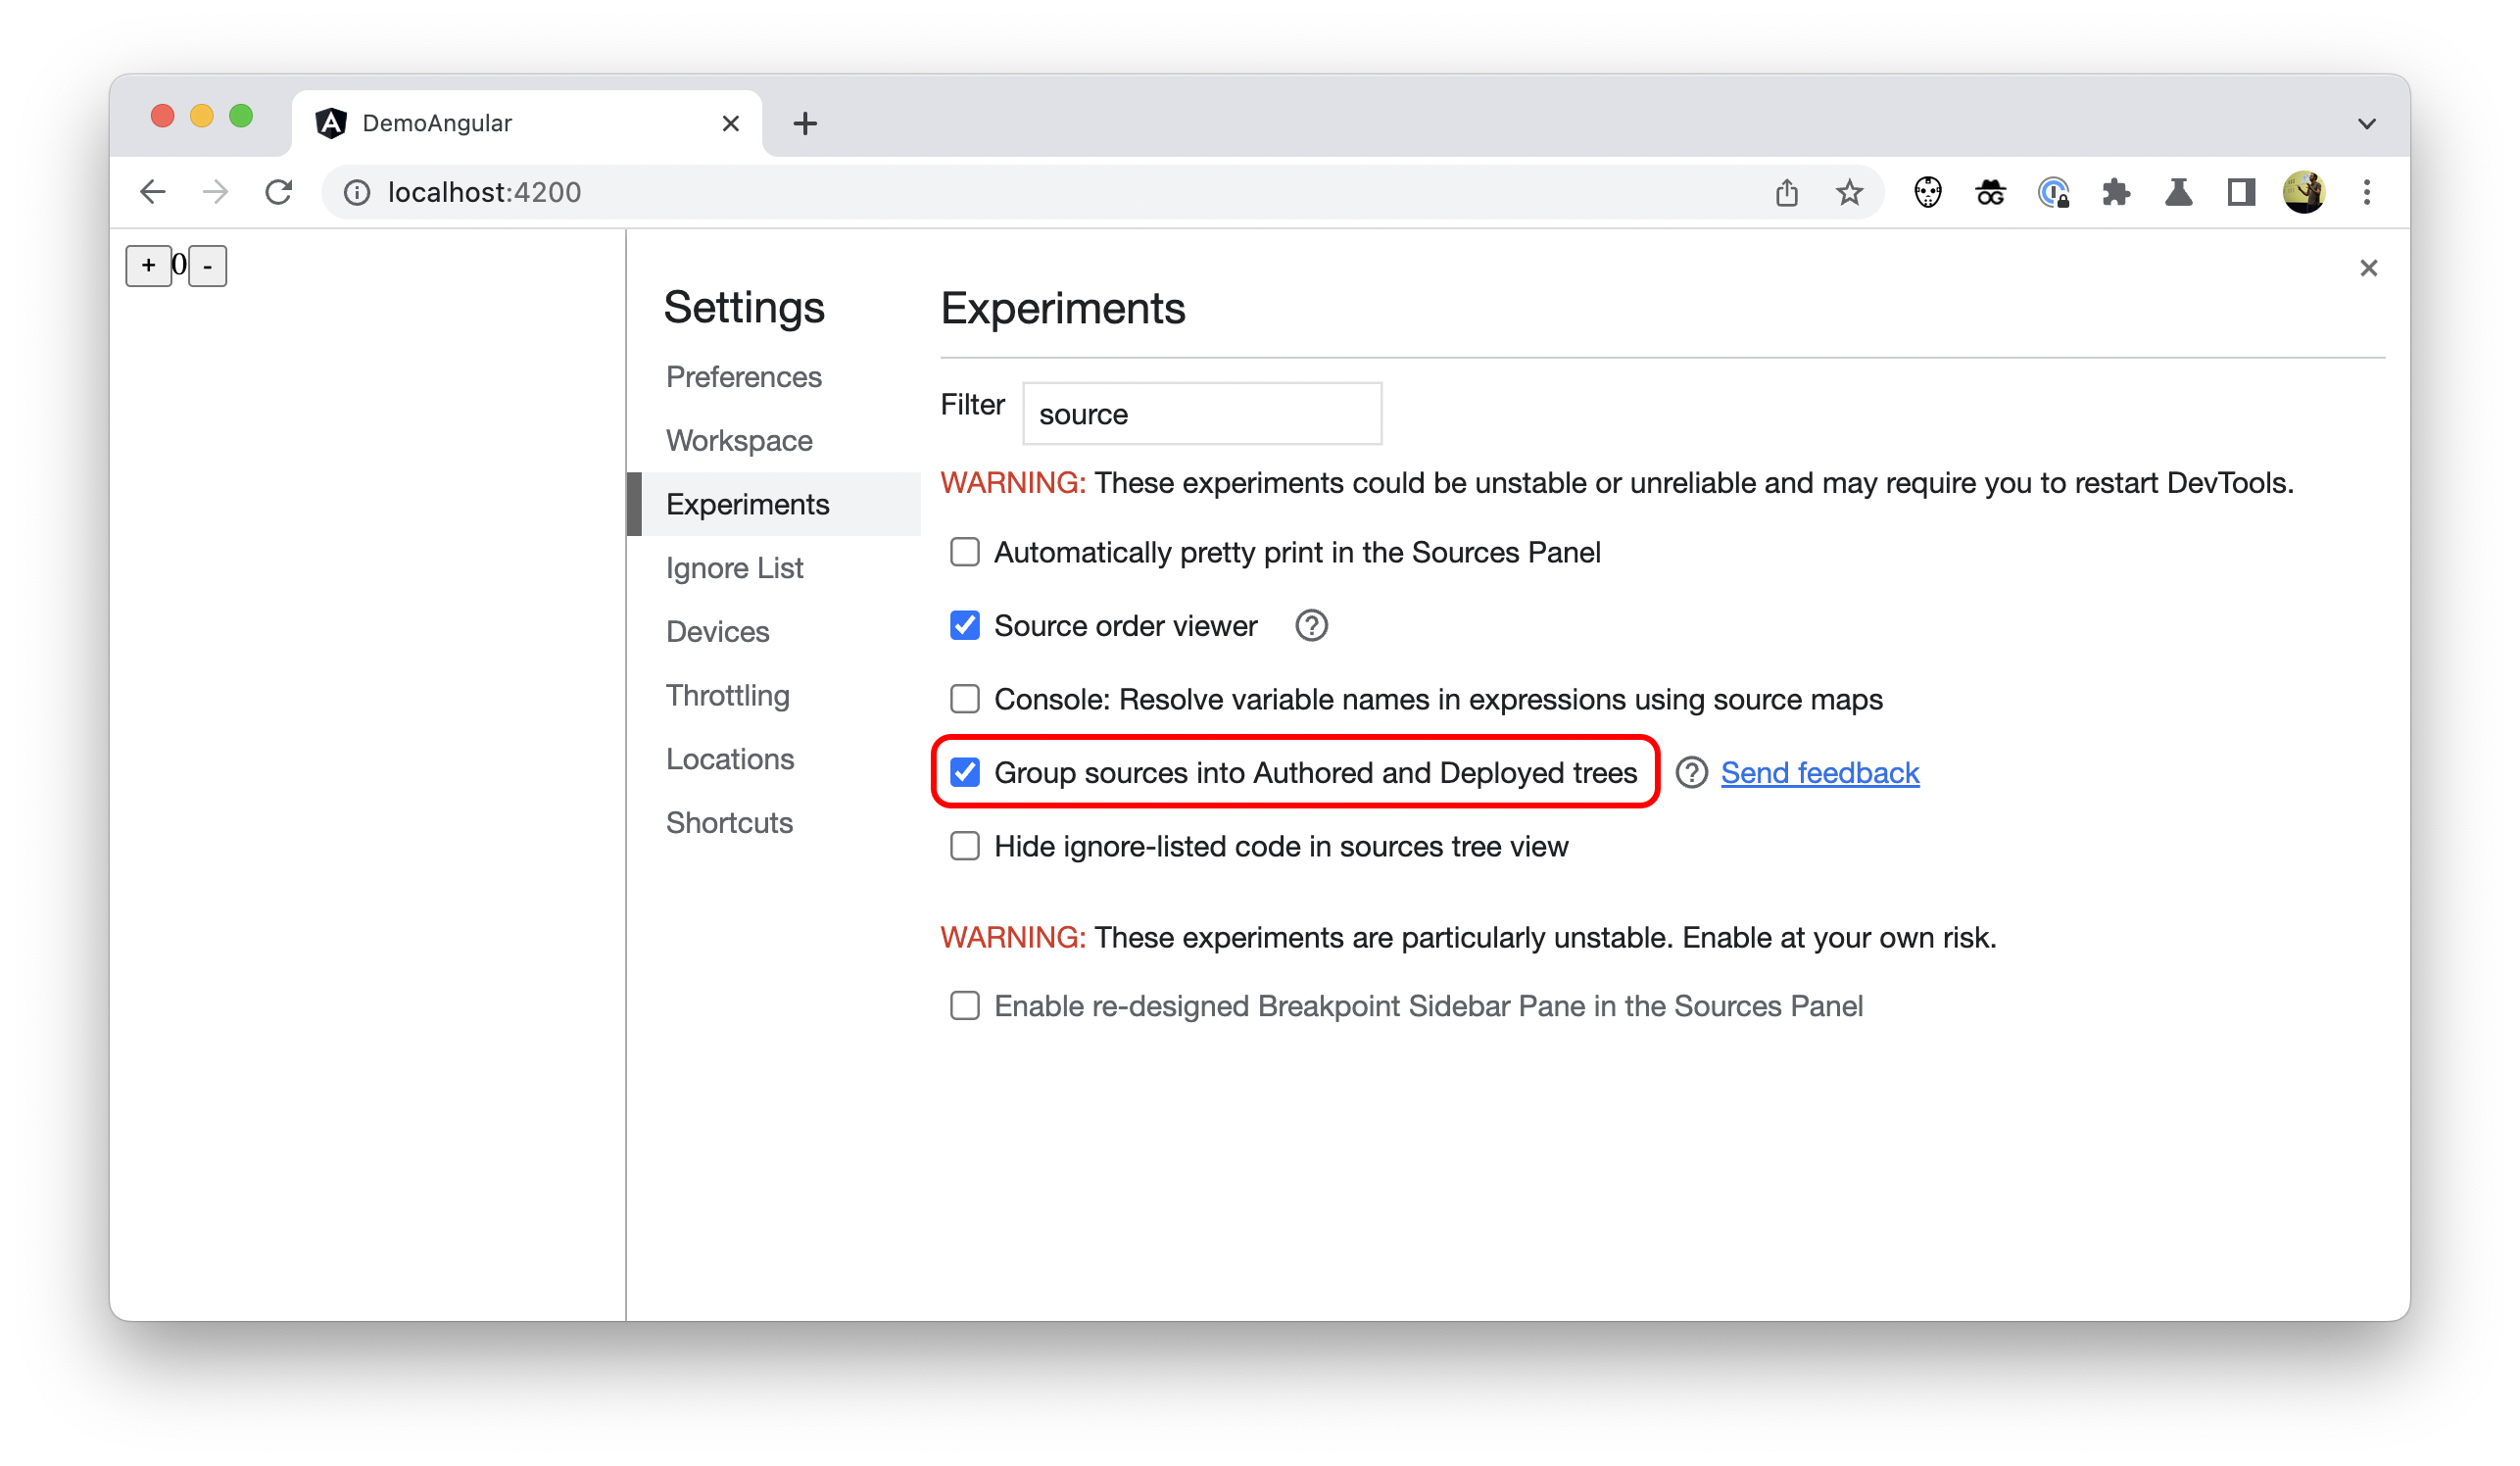
To enable this option in Chrome DevTools, go to Settings > Experiments and check Group sources into Authored and Deployed trees.
“Just my code”
When using dependencies or building on top of a framework, the third party files can get in your way. Most of the time you only want to see just your code, not that of some third-party library tucked away in the node_modules folder.
To make up for it, DevTools has an extra setting enabled by default: Automatically add known third-party scripts to ignore list. You can find it in DevTools > Settings > Ignore List.
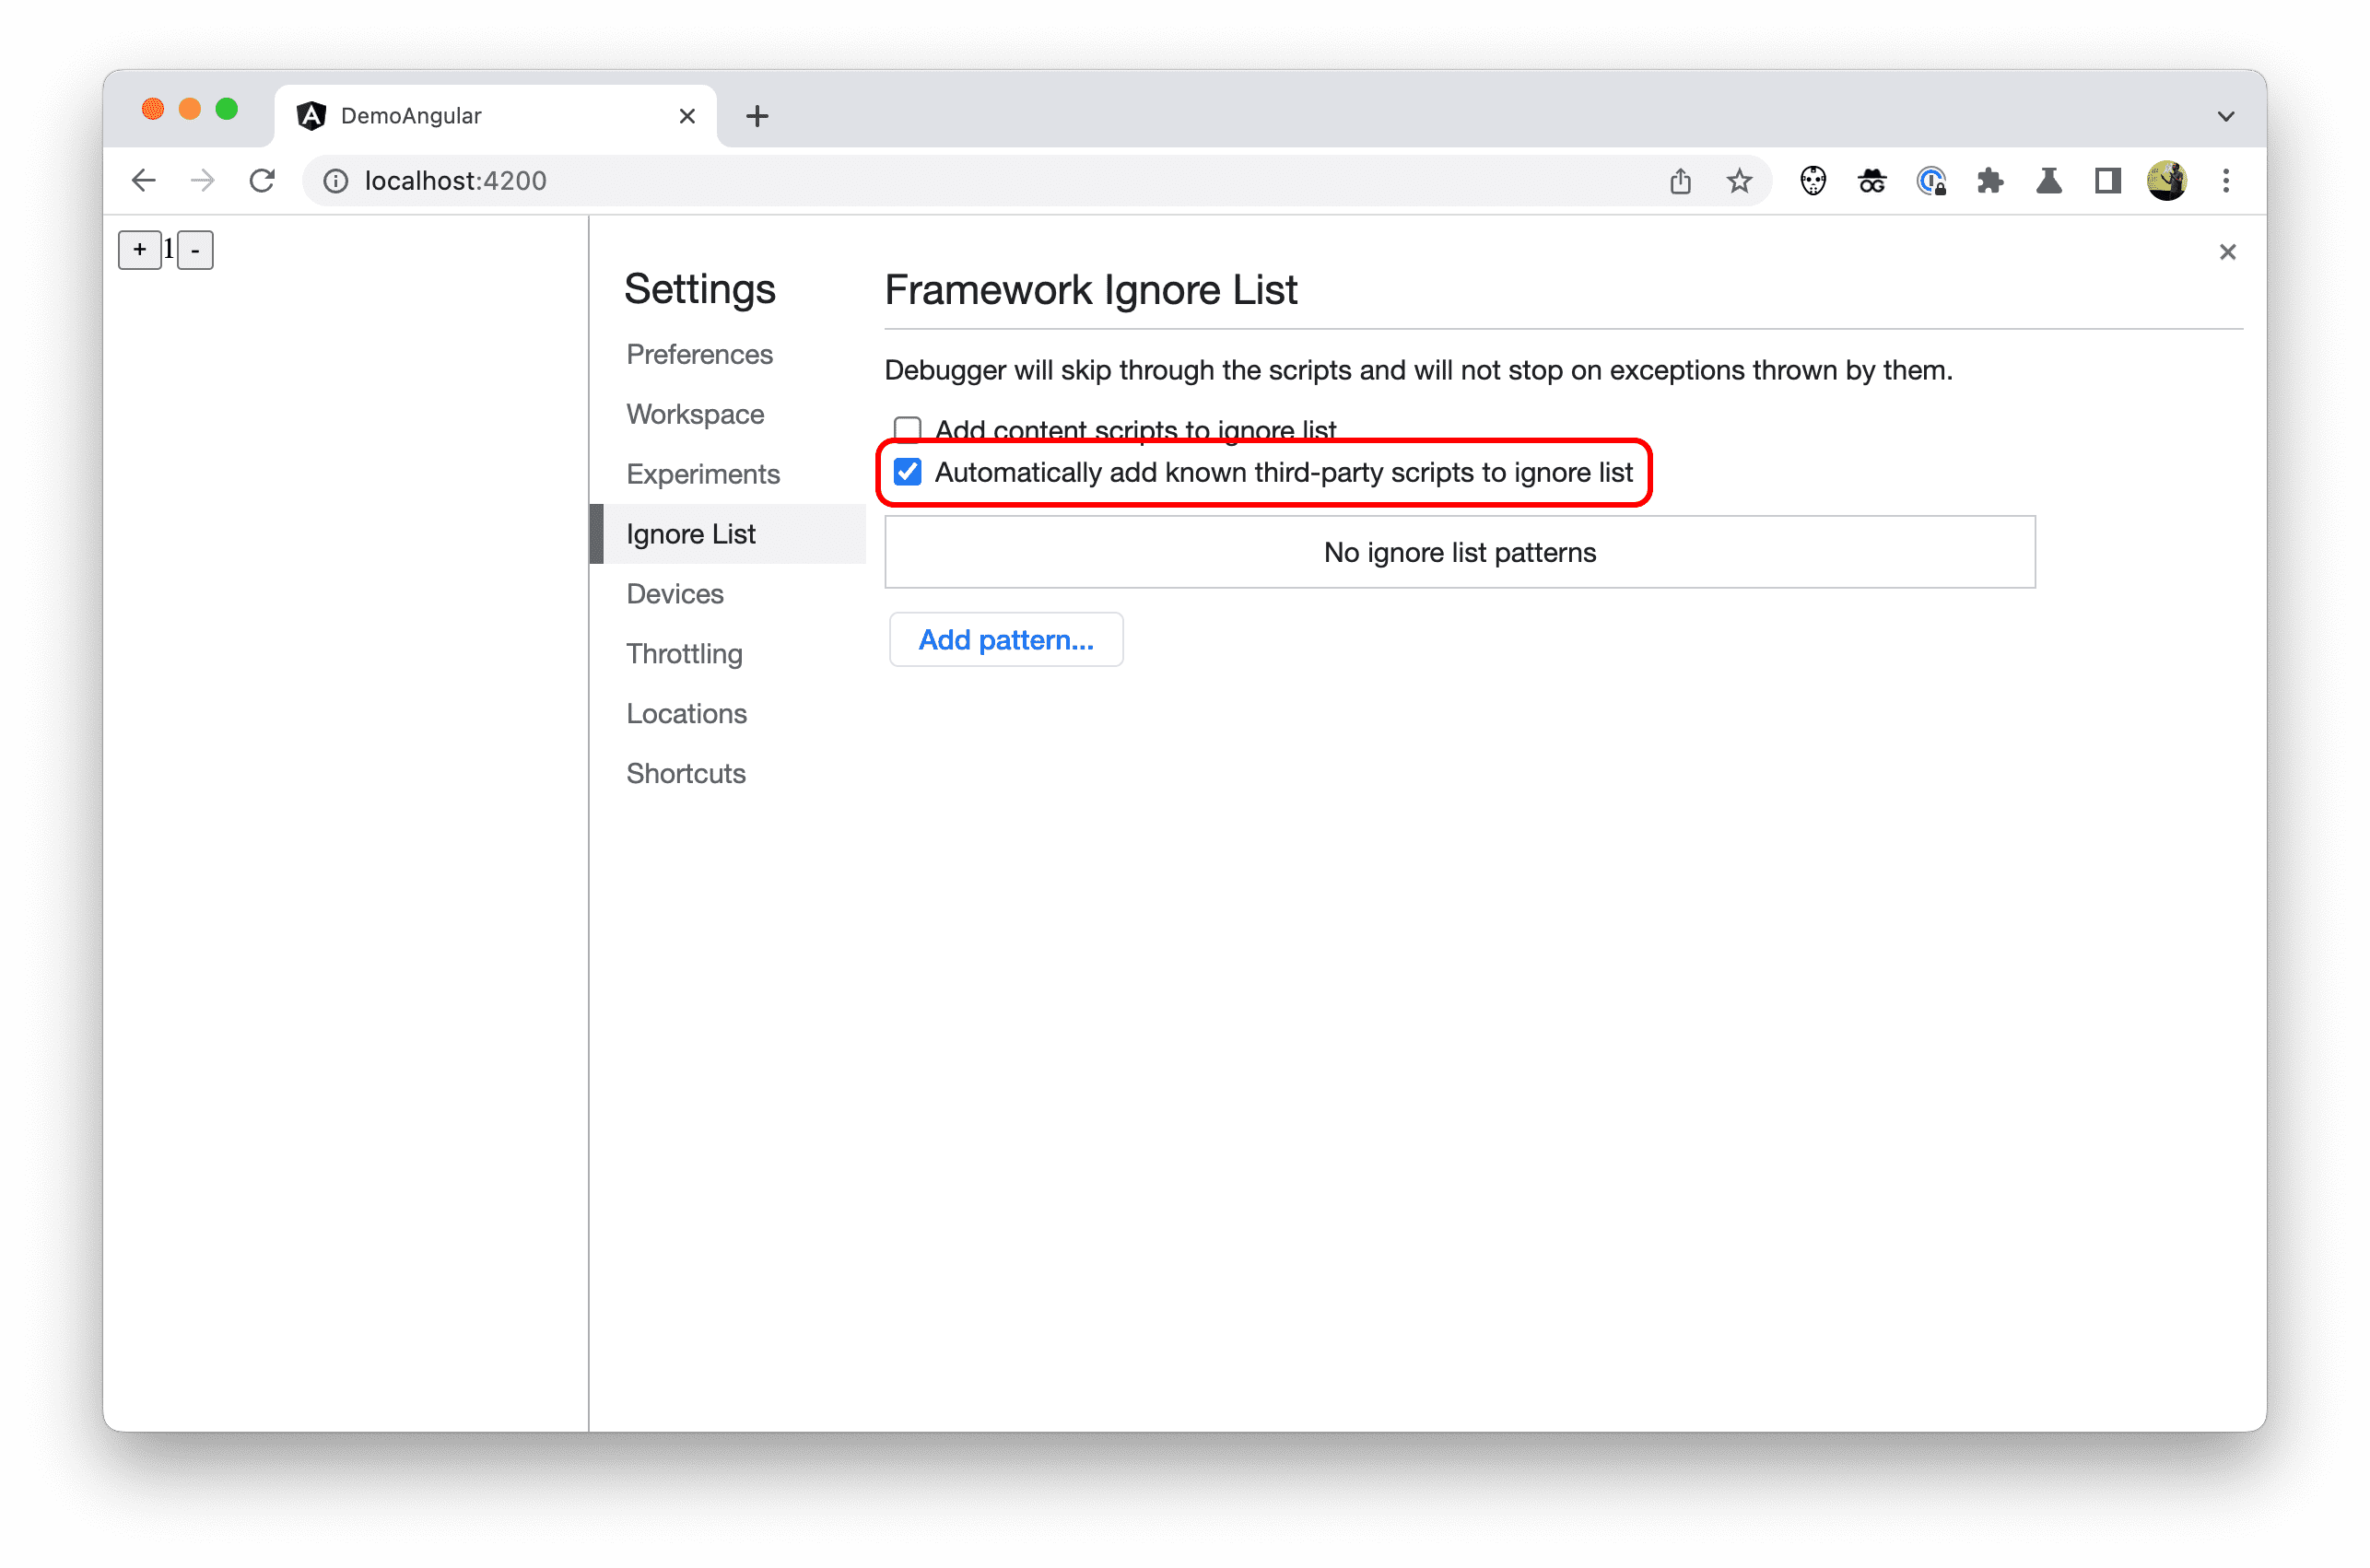
With this setting enabled, DevTools hides any file or folder that a framework or build tool has marked as to ignore.
As of Angular v14.1.0, the contents of its node_modules and webpack folders have been marked as such. Therefore, these folders, the files within them, and other such third-party artifacts don’t show up in various places in DevTools.
As an author, you don’t need to do anything to enable this new behavior. It is up to the framework to implement this change.
Ignore-listed code in stack traces
One place where these ignore-listed files no longer show up is in stack traces. As an author, you now get to see more relevant stack traces.
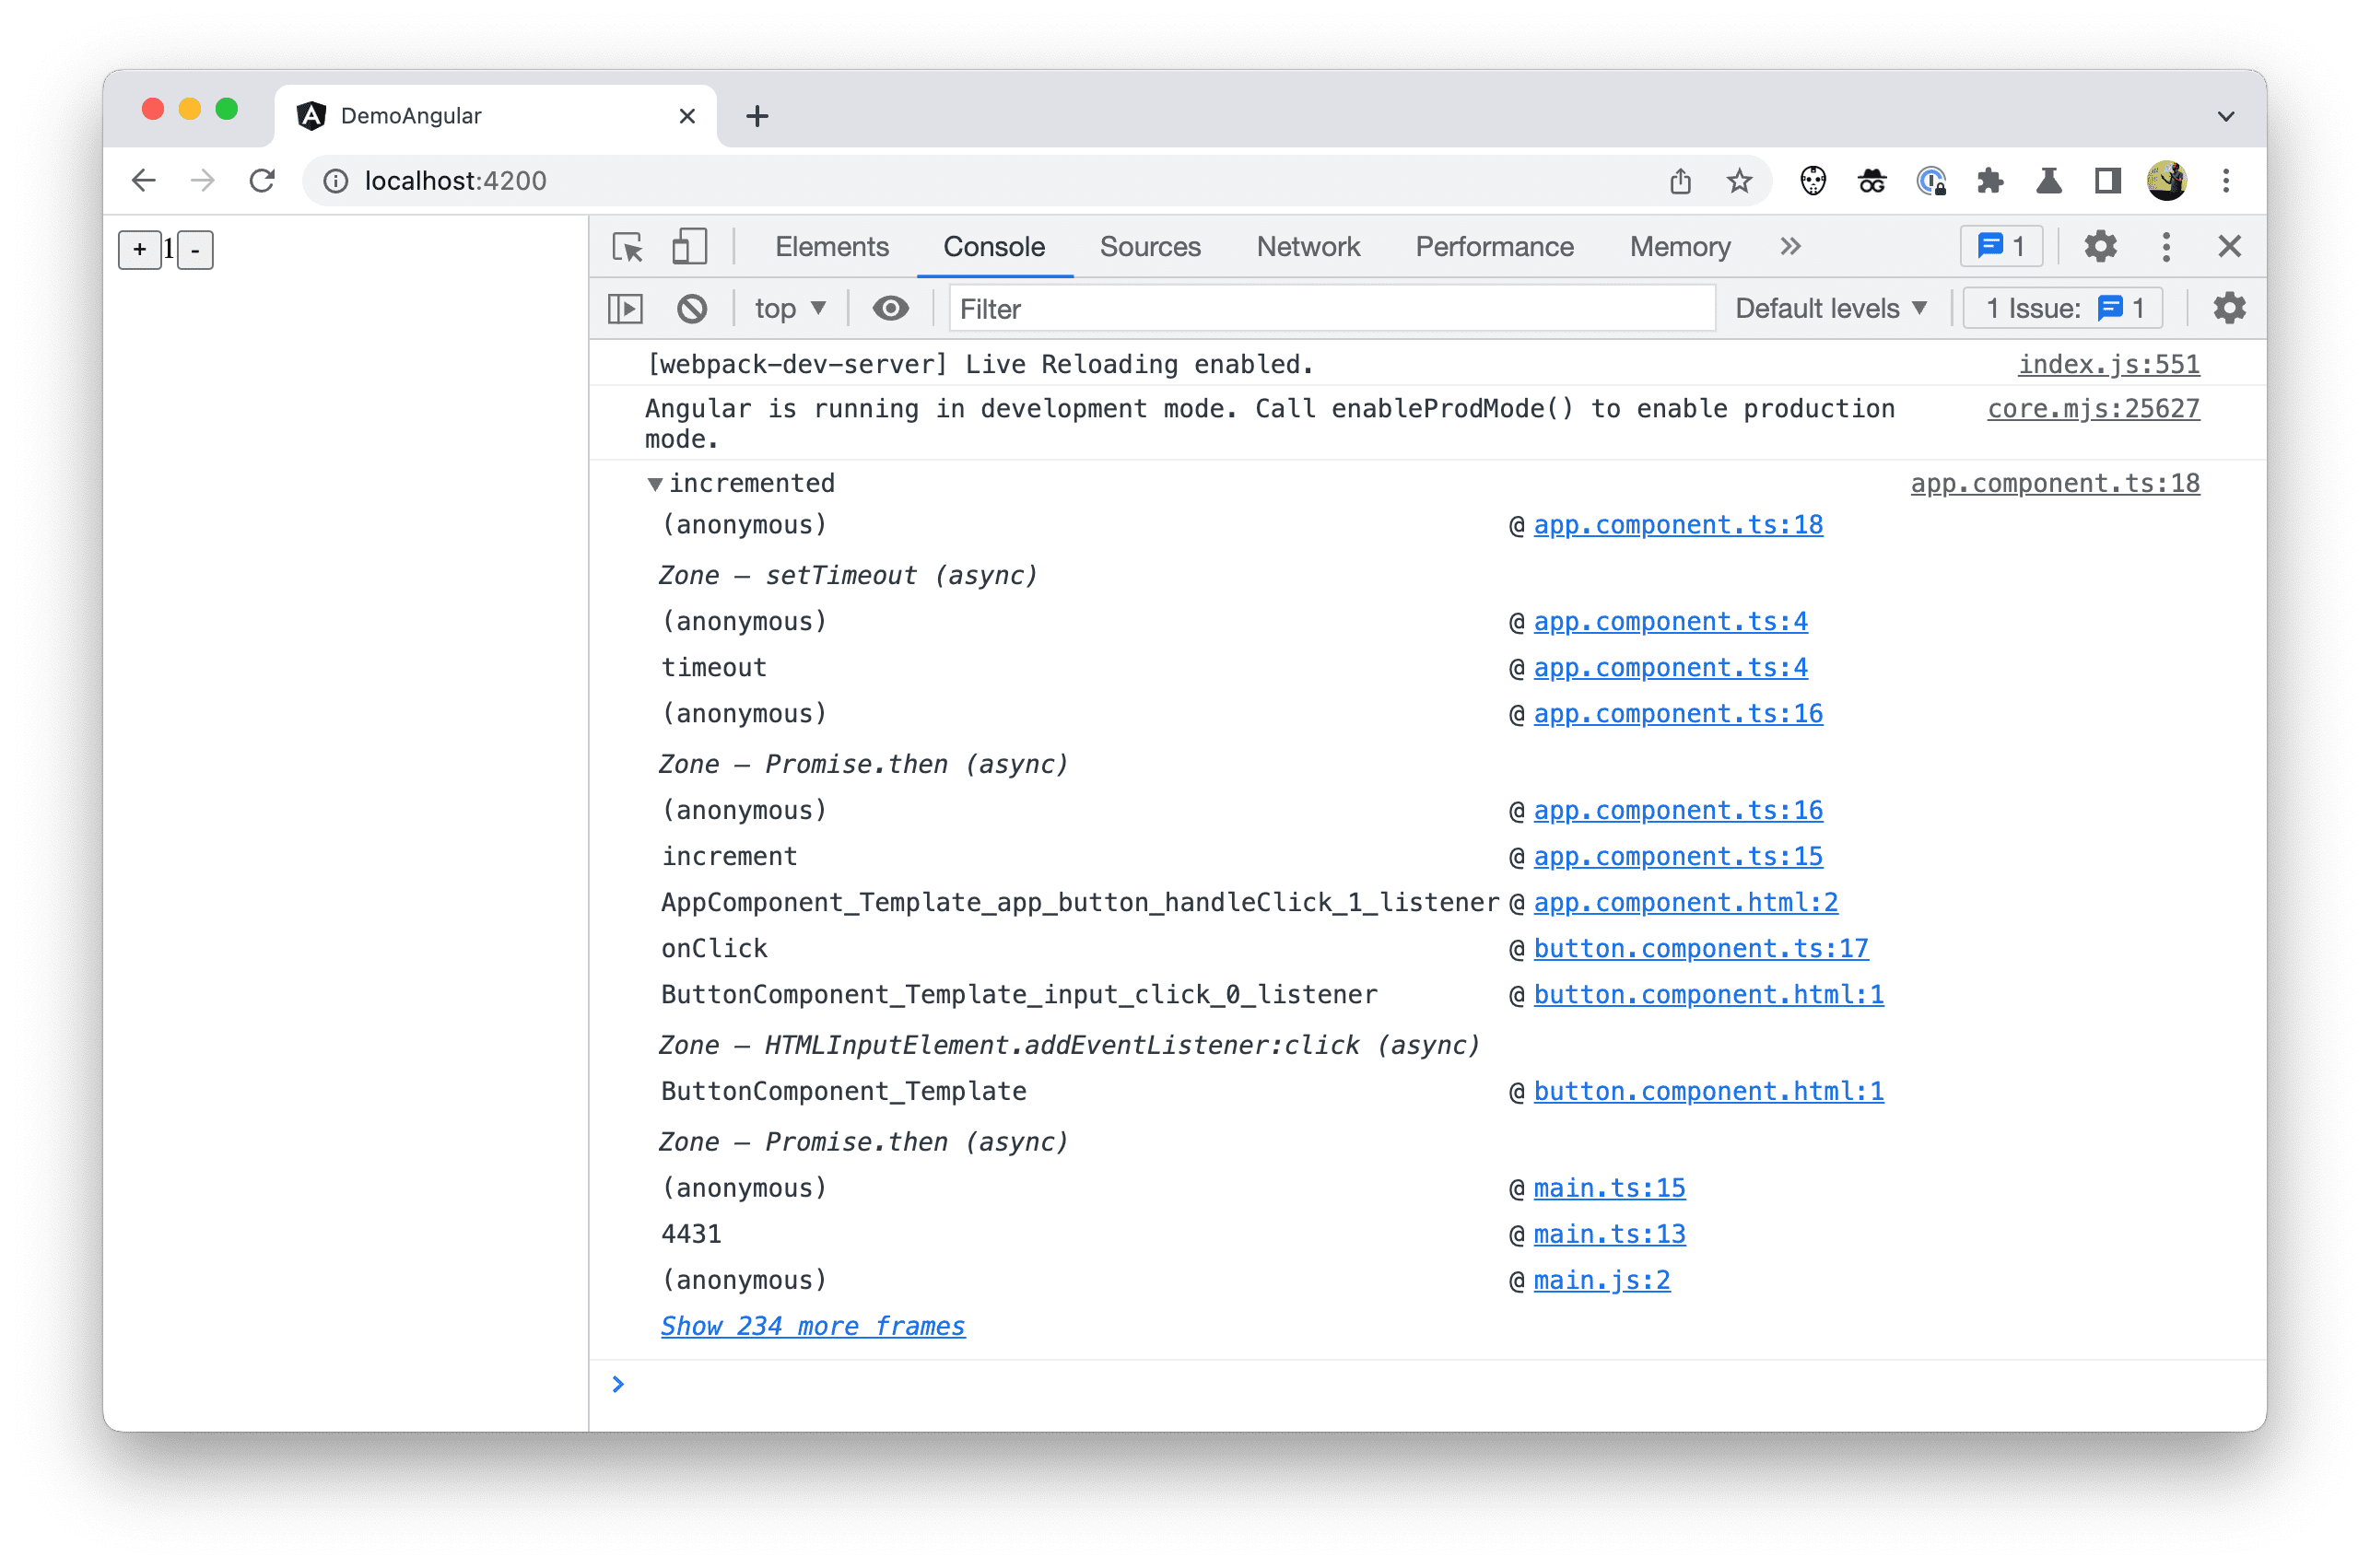
Should you want to see all call frames of the stack trace, you can always click the Show more frames link.
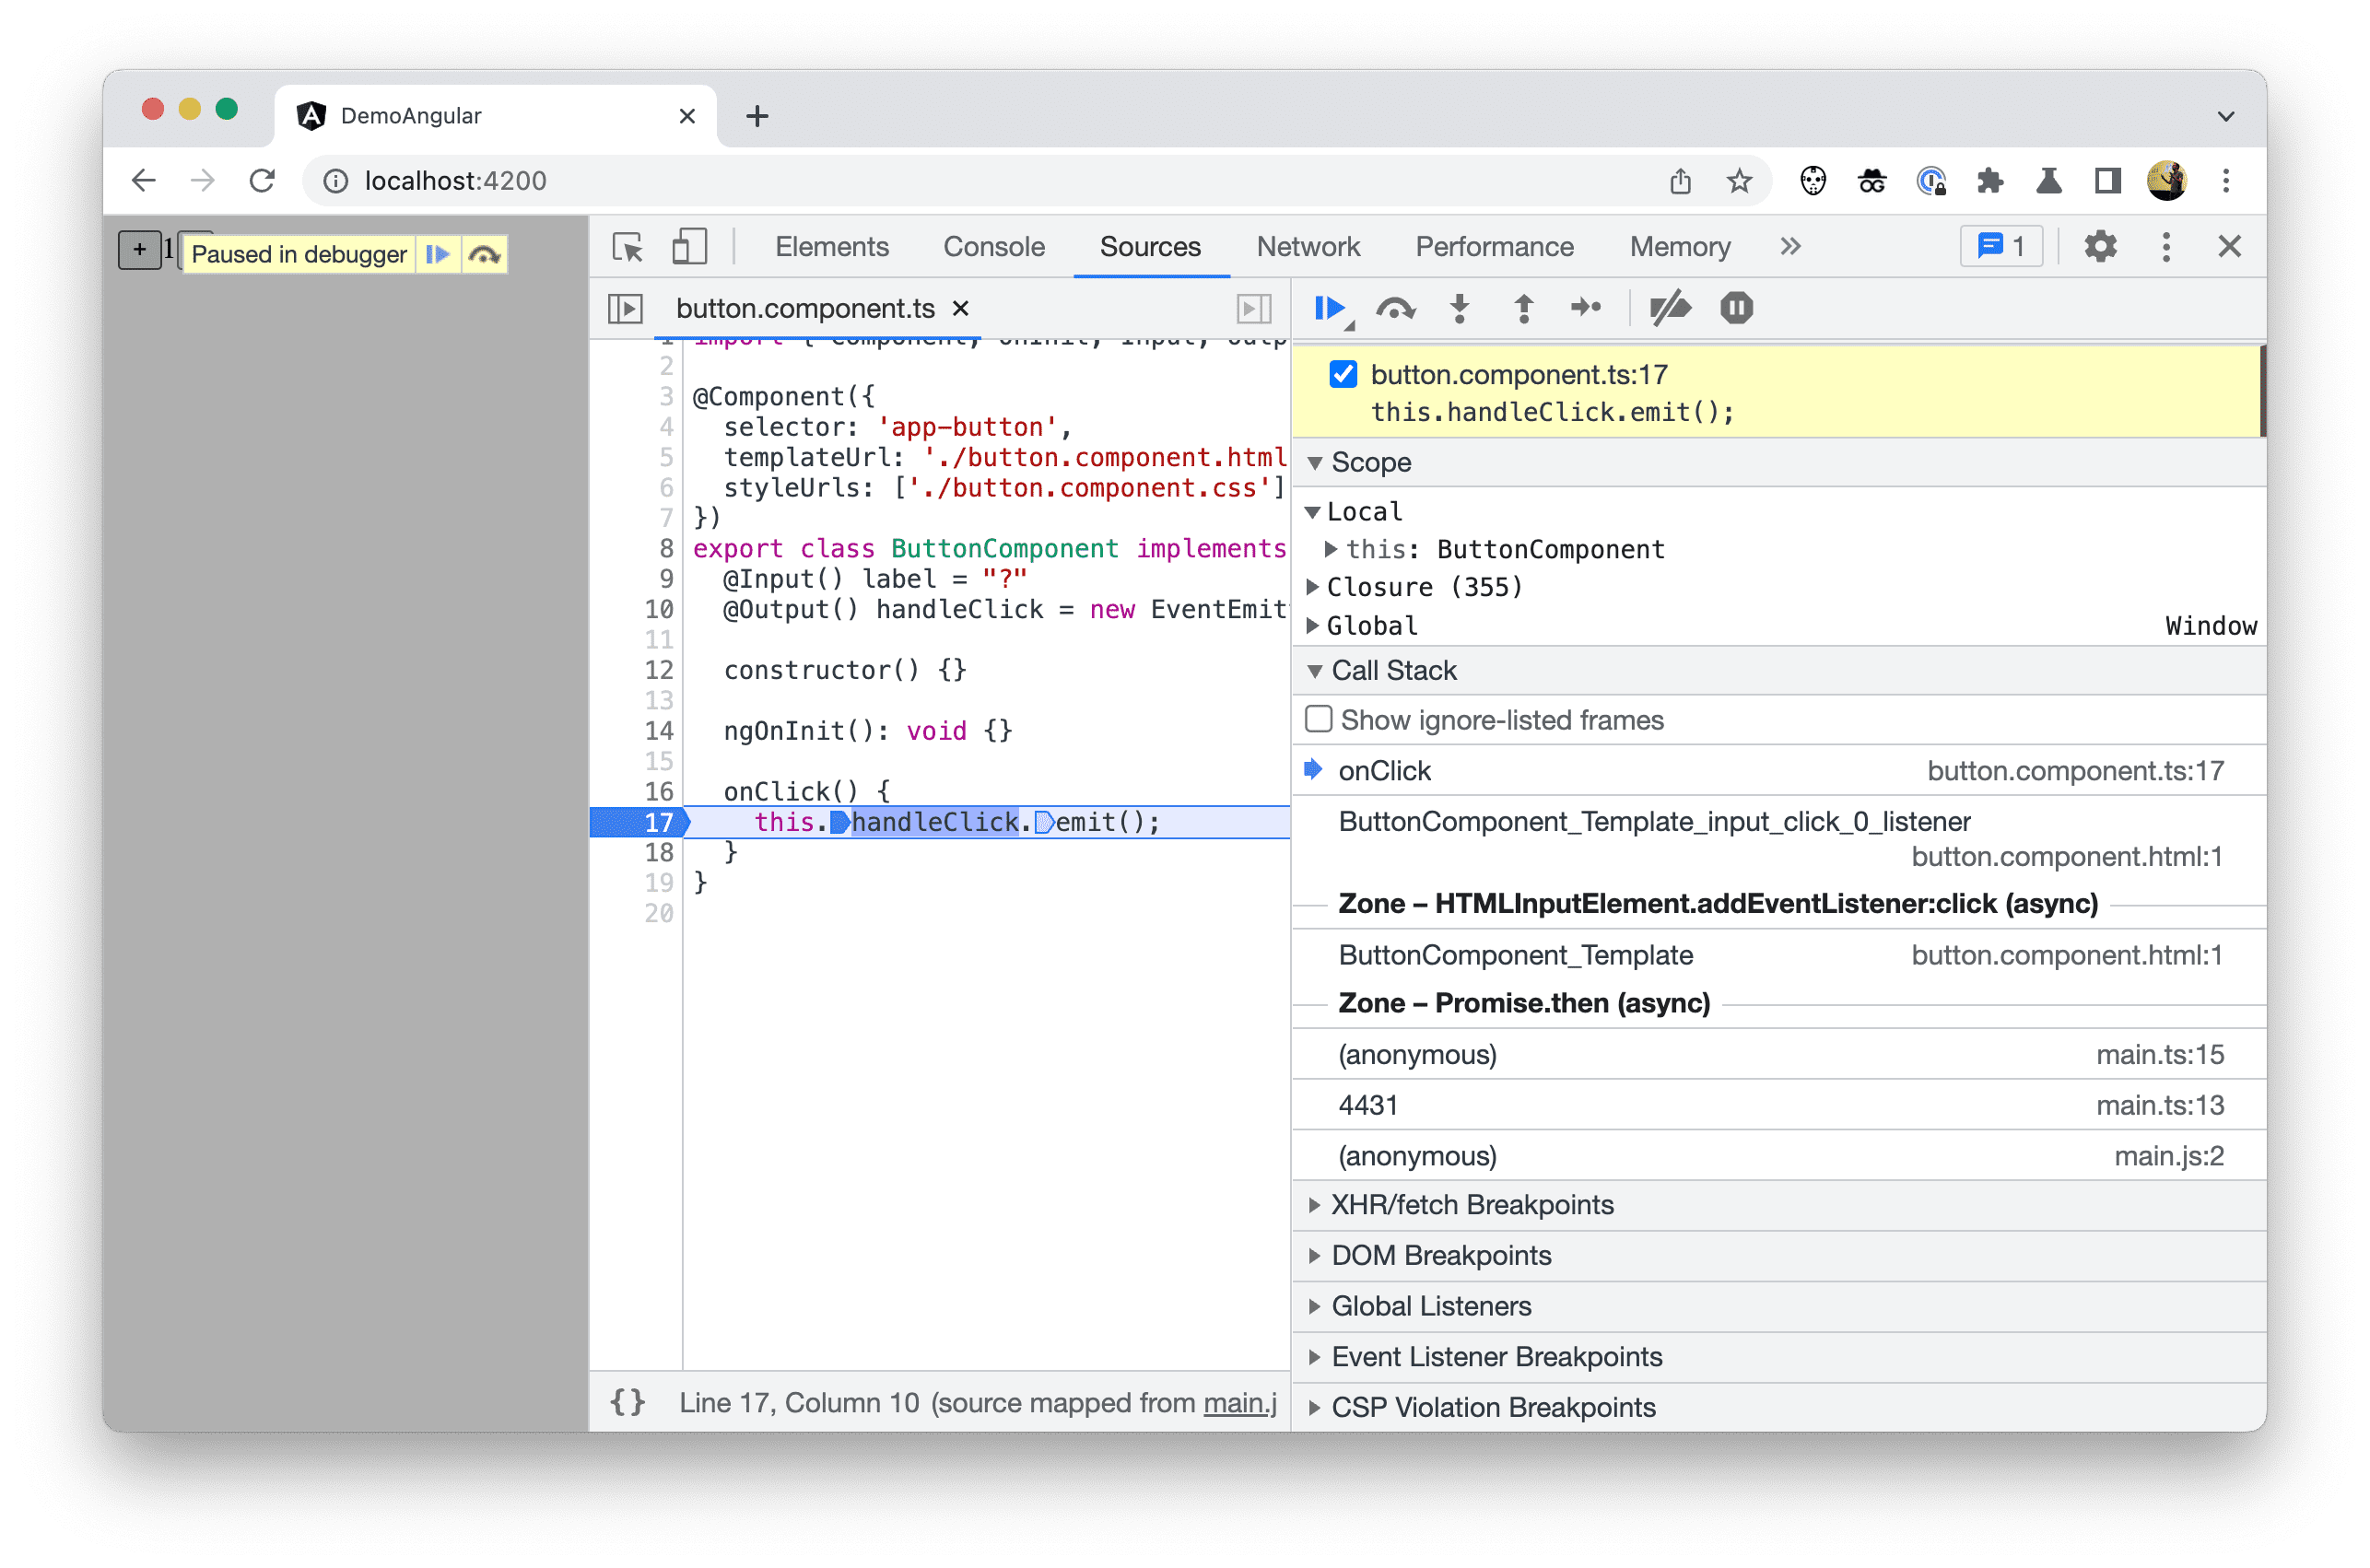
The same applies for the call stacks that you see while debugging and stepping through your code. When frameworks or bundlers inform DevTools about third-party scripts, DevTools automatically hides all irrelevant call frames and jumps over any ignore-listed code while step-debugging.
Ignore-listed code in the file tree
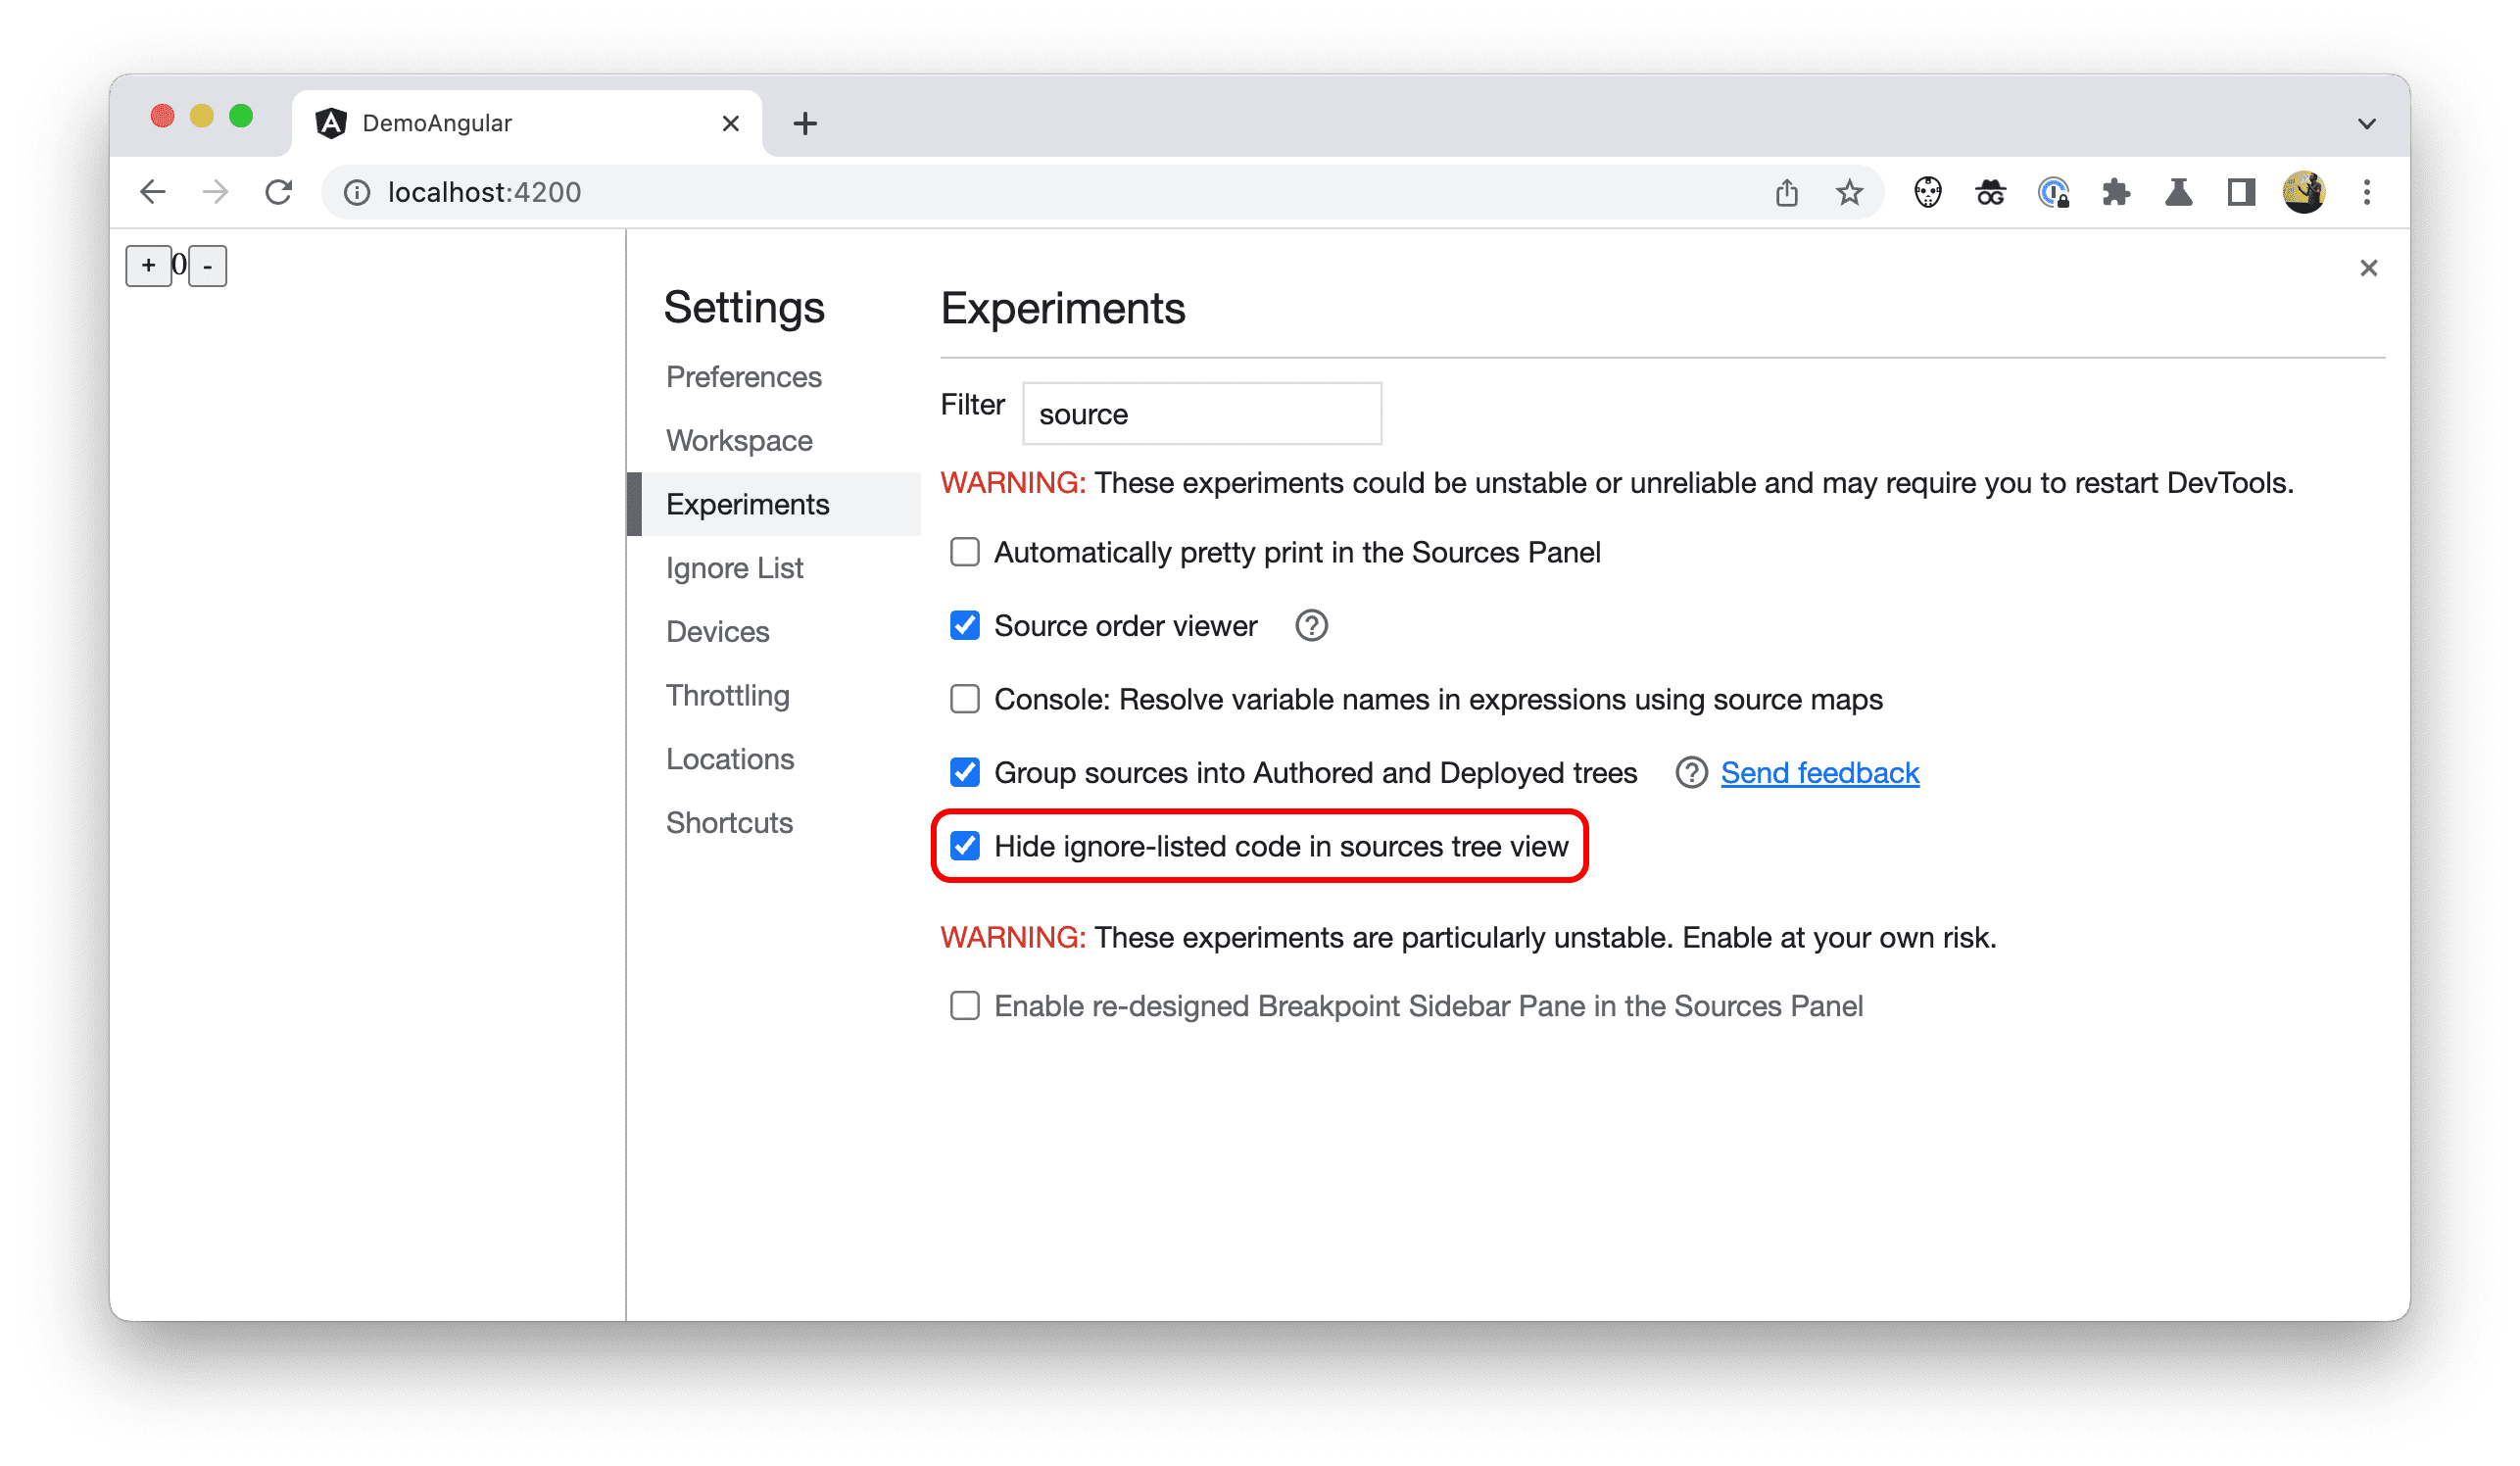
To hide the ignore-listed files and folders from the Authored Code file tree in the Sources panel, check Hide ignore-listed code in sources tree view in Settings > Experiments in DevTools.
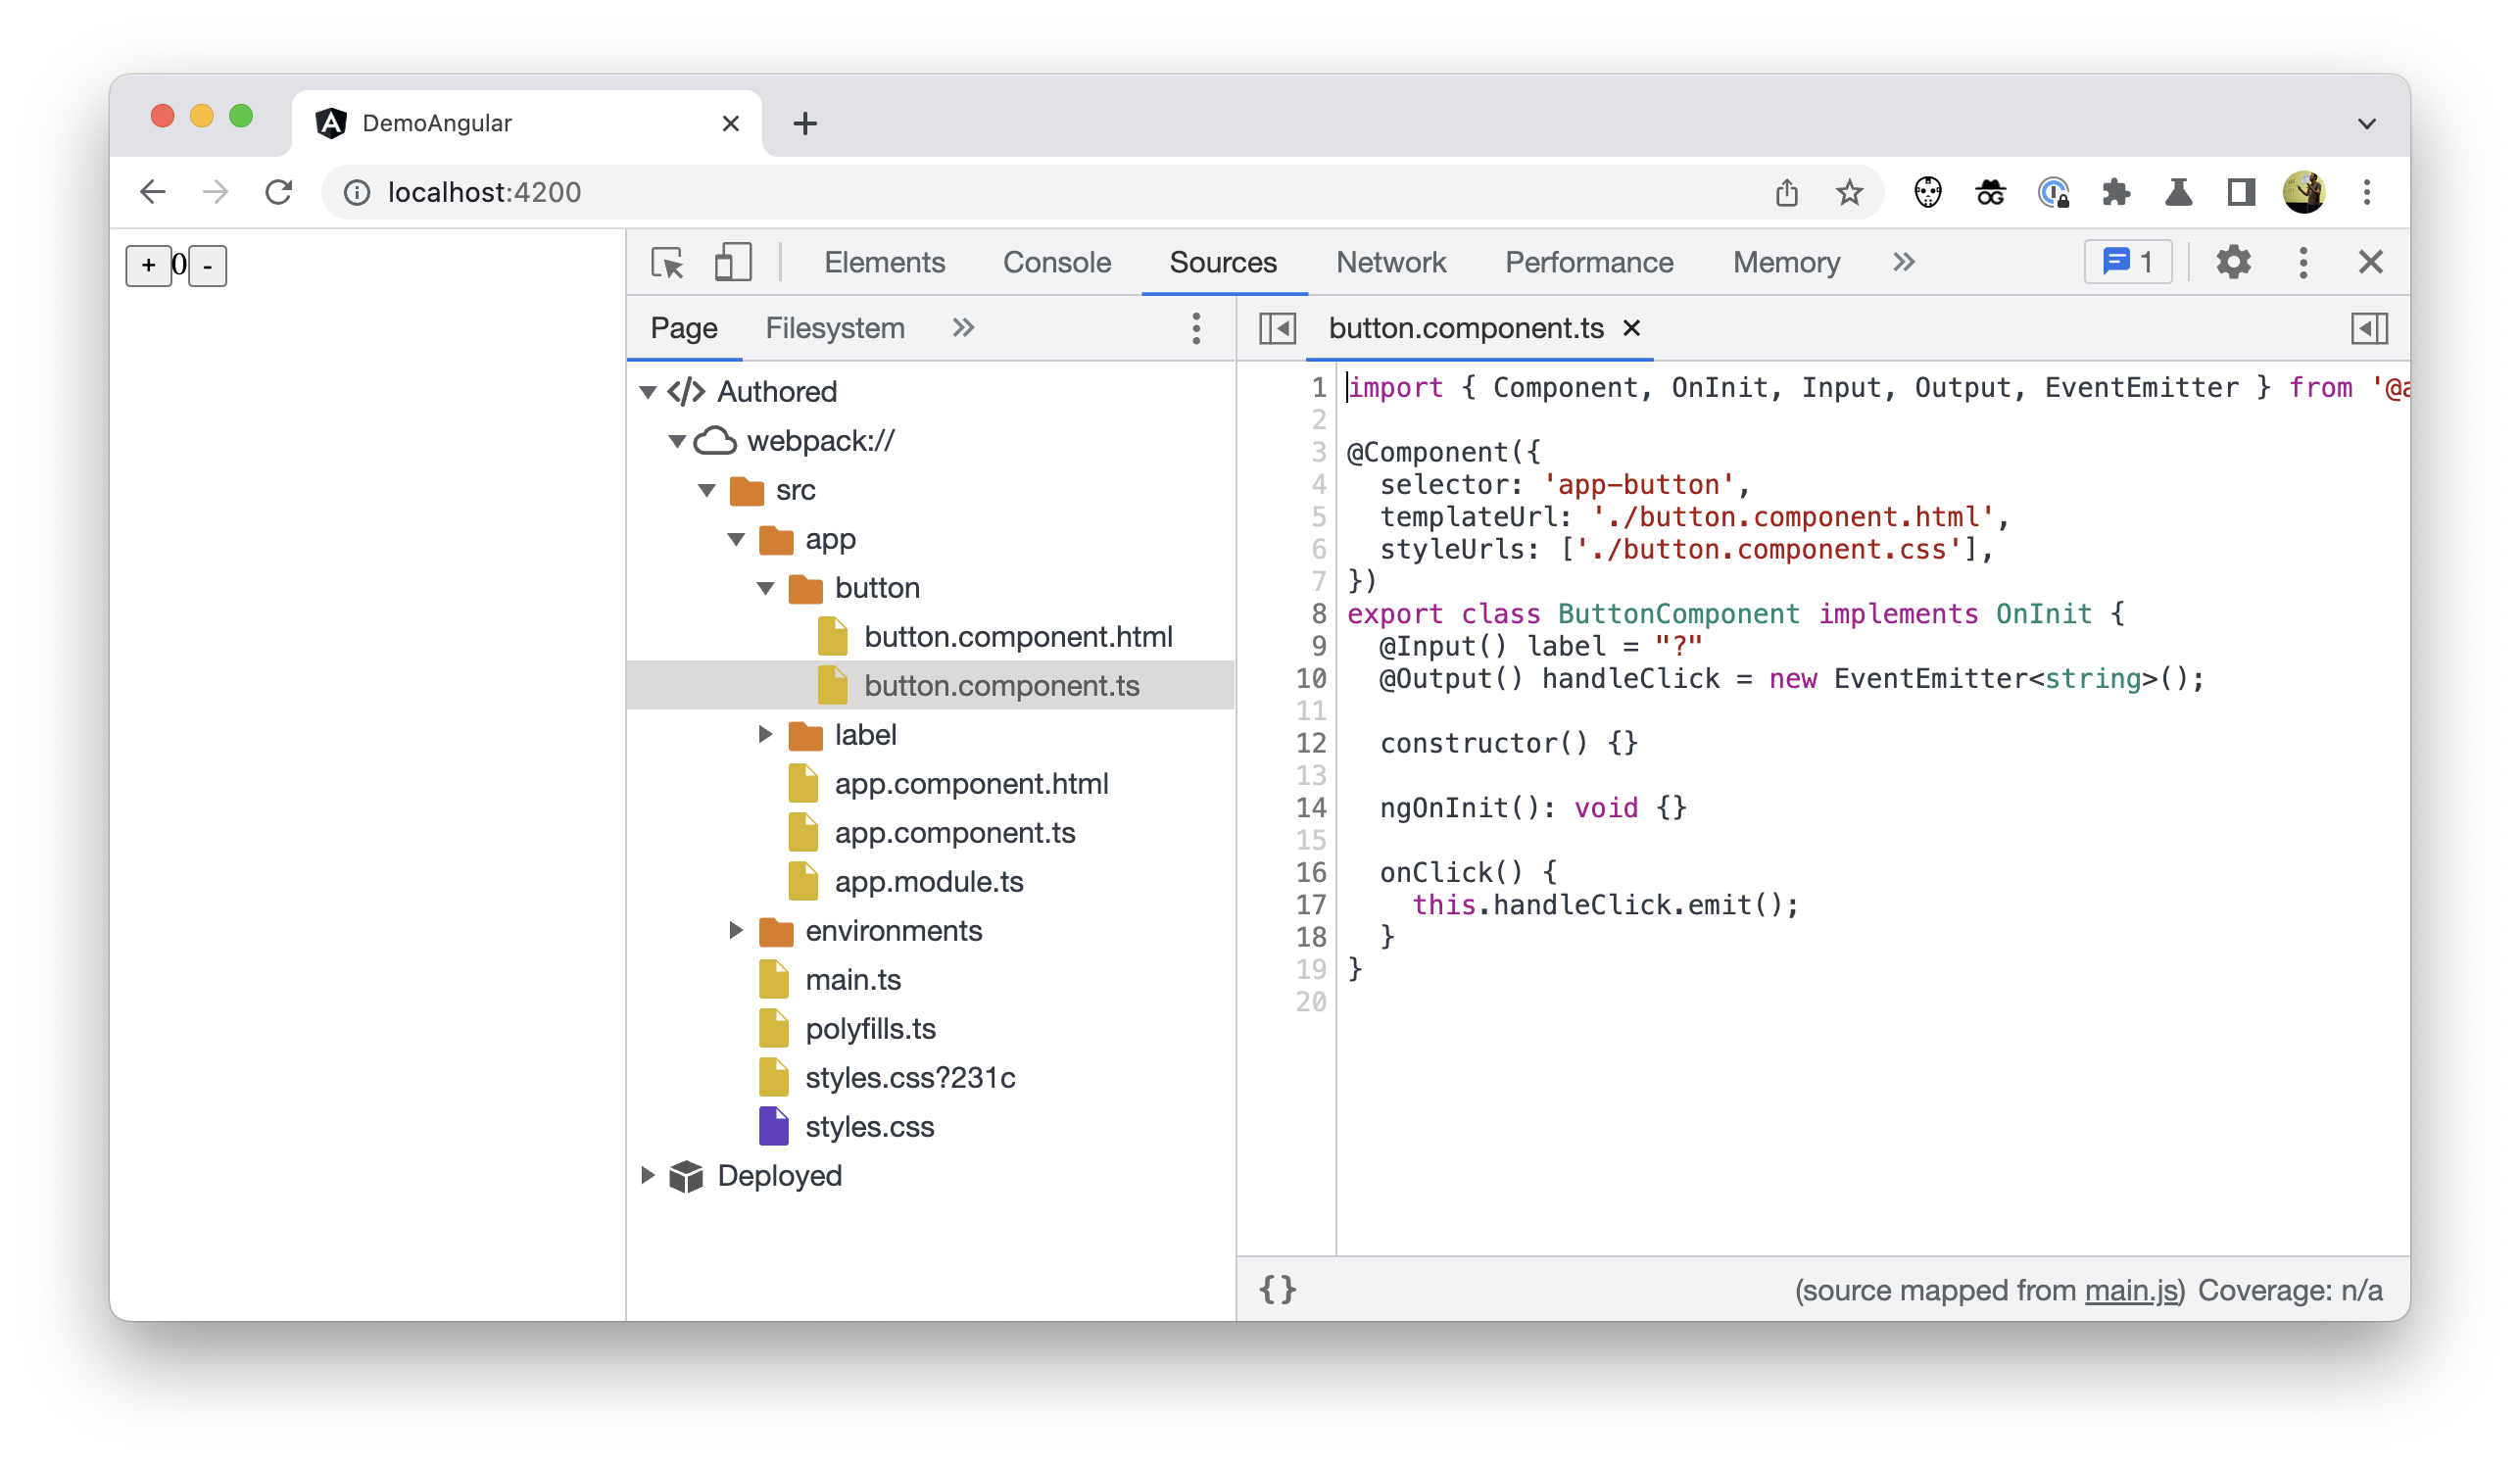
In the sample Angular project, the node_modules and webpack folders are now hidden.
Ignore-listed code in the “Quick Open” menu
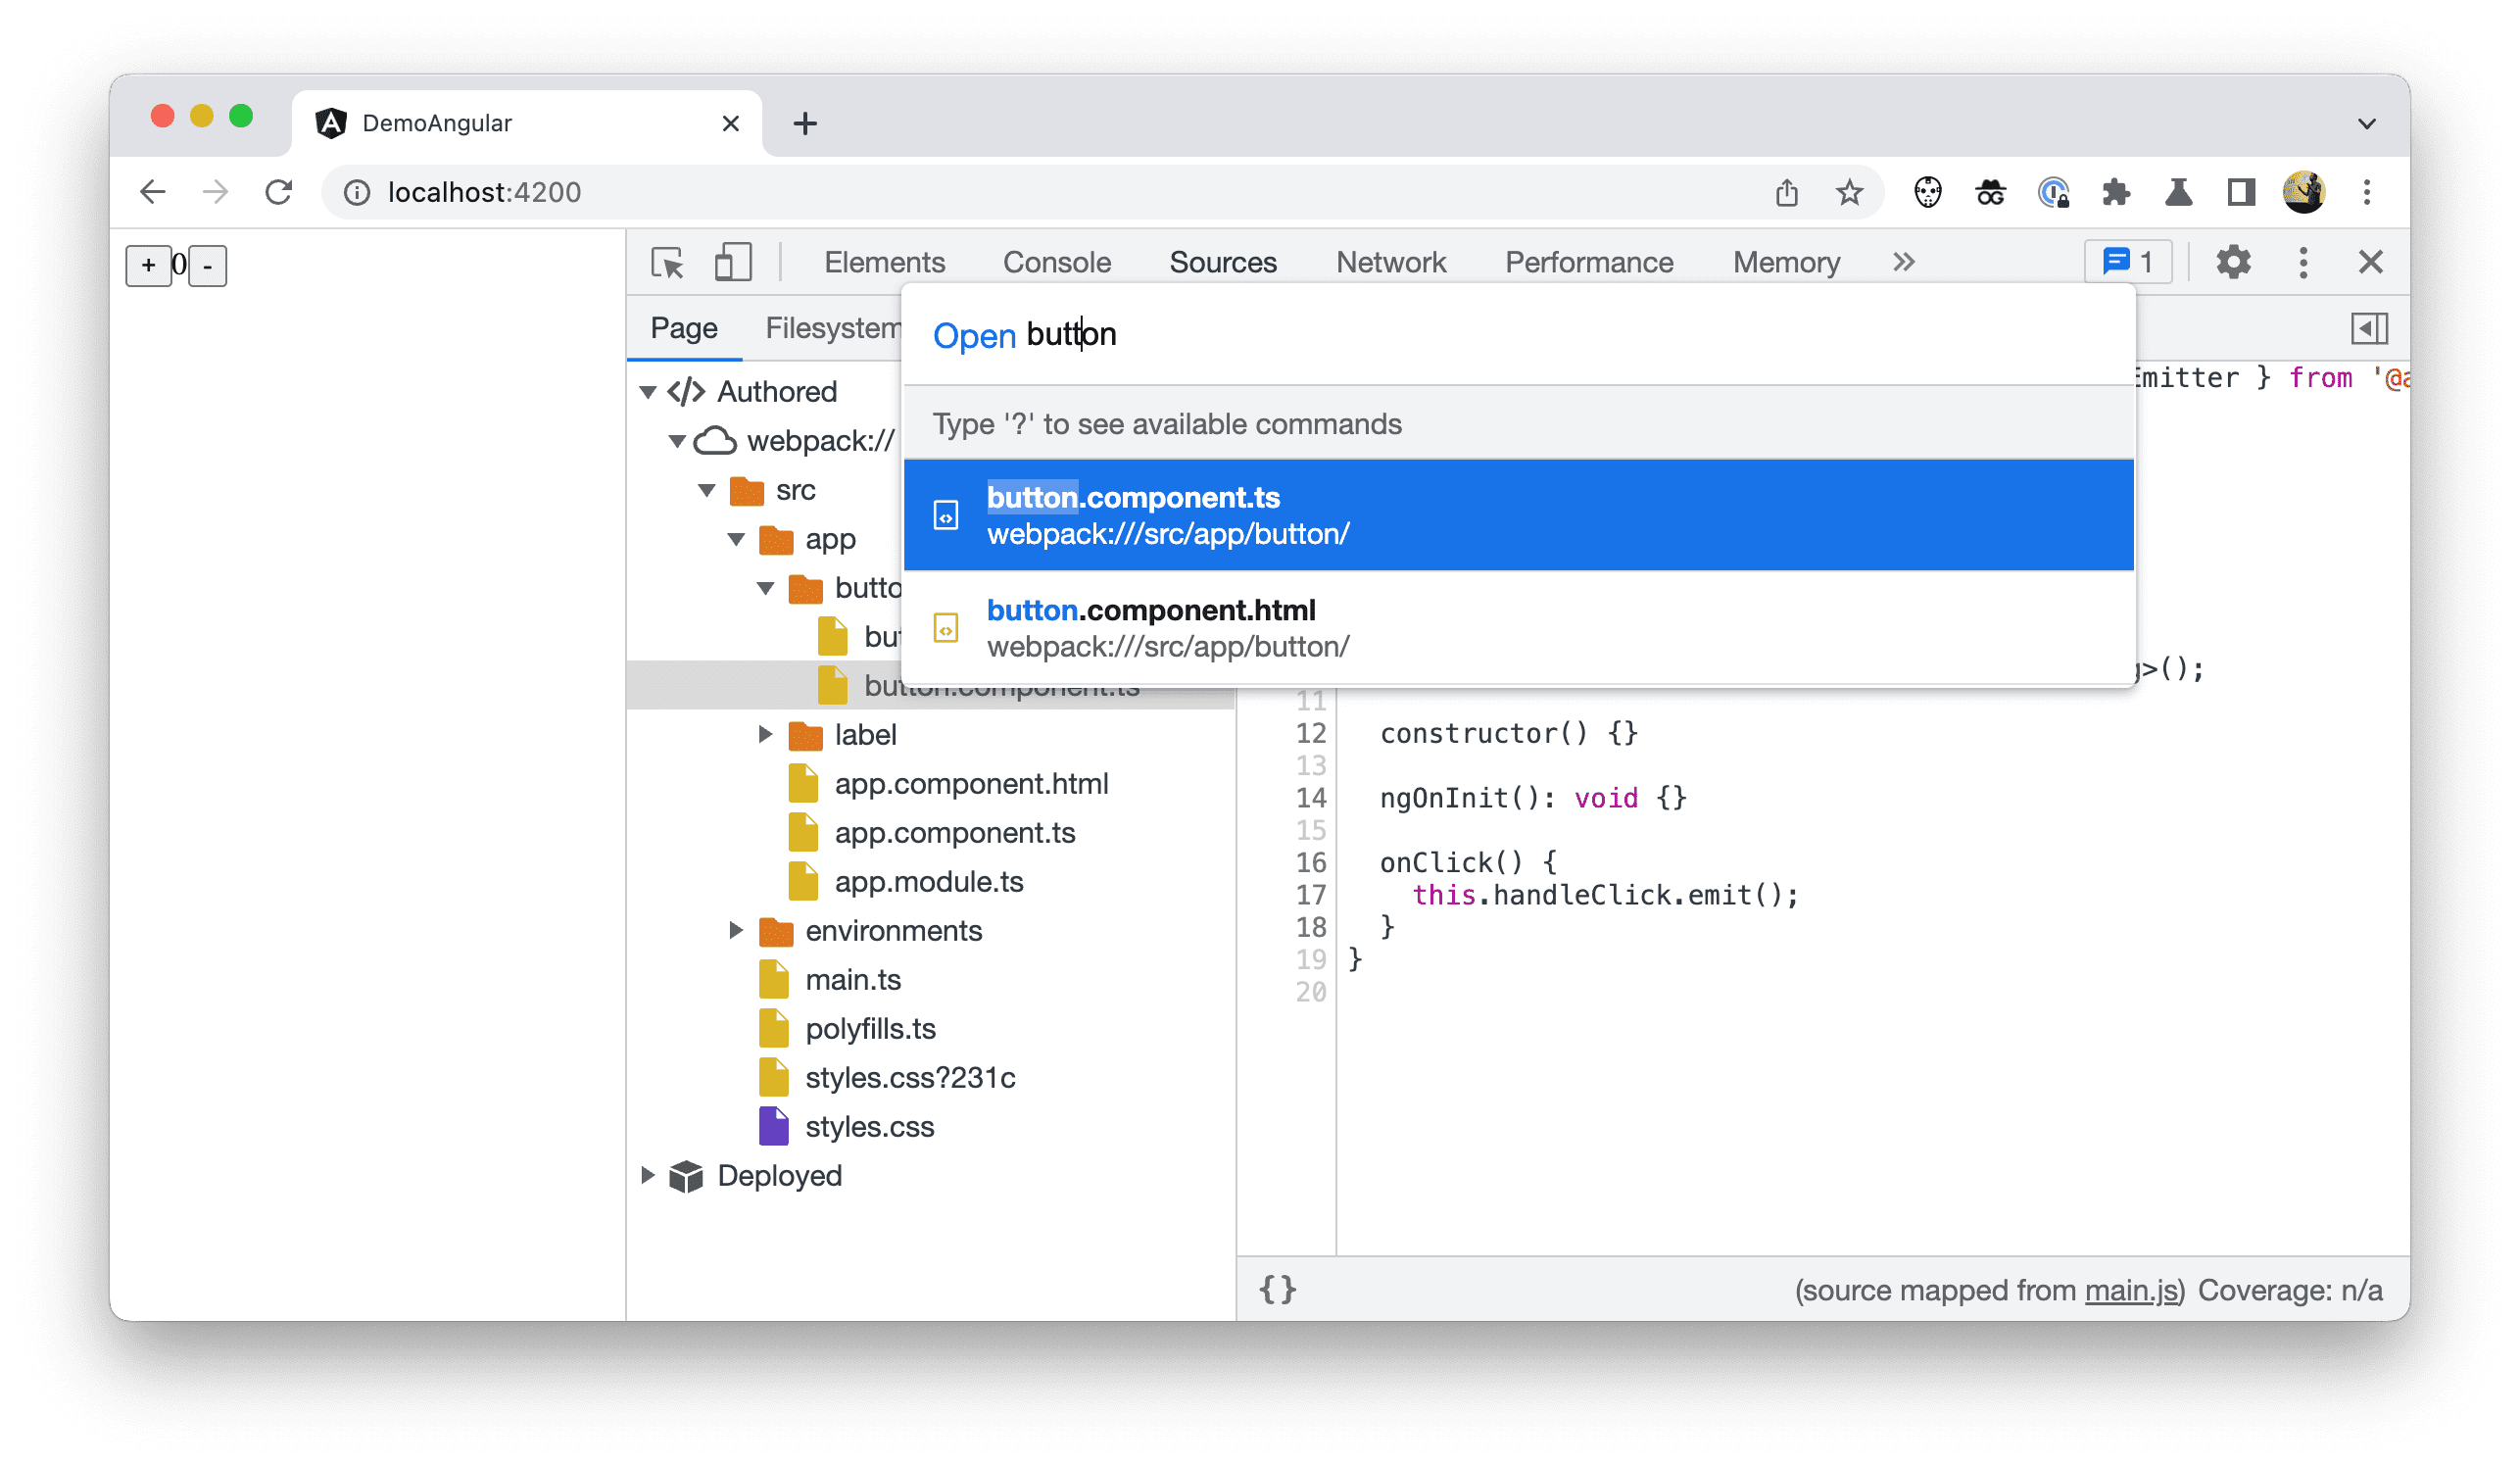
Ignored-listed code is not only hidden from the file tree, but is also hidden from the “Quick Open” menu (Control+P (Linux/Windows) or Command+P (Mac)).
More improvements to stack traces
Having already covered relevant stack traces, Chrome DevTools introduces even more improvements to stack traces.
Linked Stack Traces
When some operations are scheduled to happen asynchronously, the stack traces in DevTools currently tell only part of the story.
For example, here’s a very simple scheduler in a hypothetical framework.js file:
function makeScheduler() {
  const tasks = [];

  return {
    schedule(f) {
      tasks.push({ f });
    },

    work() {
      while (tasks.length) {
        const { f } = tasks.shift();
        f();
      }
    },
  };
}

const scheduler = makeScheduler();

function loop() {
  scheduler.work();
  requestAnimationFrame(loop);
};

loop();
… and how a developer might use it in their own code in an example.js file:
function someTask() {
  console.trace("done!");
}

function businessLogic() {
  scheduler.schedule(someTask);
}

businessLogic();
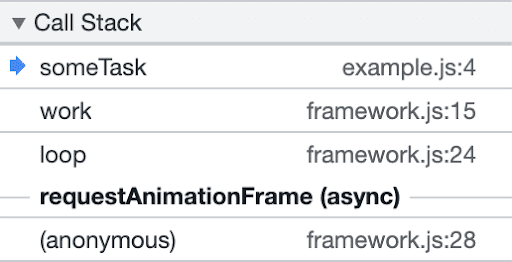
When adding a breakpoint inside the someTask method or when inspecting the trace printed in the console, you don’t see any mention of the businessLogic() call that was the “root cause” of this operation.
Instead, you see only the framework scheduling logic that led to task execution and no breadcrumbs in stack trace to help you figure out the causal links between events leading to this task.
Thanks to a new feature called “Async Stack Tagging”, it is possible to tell the whole story after all by linking both parts of the async code together.
The Async Stack Tagging API introduces a new console method named console.createTask(). The API signature is as follows:
interface Console {
  createTask(name: string): Task;
}

interface Task {
  run<T>(f: () => T): T;
}
The console.createTask() call returns a Task instance that you can later use to run the task’s content f.
// Task Creation
const task = console.createTask(name);

// Task Execution
task.run(f);
The task forms the link between the context where it was created and the context of the async function that is being executed.
Applied to the makeScheduler function from above, the code becomes the following:
function makeScheduler() {
  const tasks = [];

  return {
    schedule(f) {
      const task = console.createTask(f.name);
      tasks.push({ task, f });
    },

    work() {
      while (tasks.length) {
        const { task, f } = tasks.shift();
        task.run(f); // instead of f();
      }
    },
  };
}
Thanks to this, Chrome DevTools is now able to show a better stack trace.
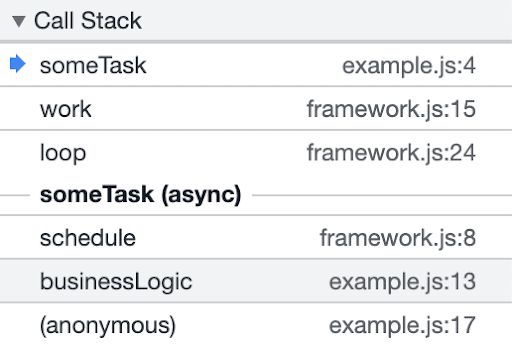
Notice how businessLogic() is now included in the stack trace! Not only that, but the task has a familiar name someTask instead of the generic requestAnimationFrame as before.
Friendly Call Frames
Frameworks often generate code from all kinds of templating languages when building a project, such as Angular or JSX templates that turn HTML-looking code into plain JavaScript that eventually runs in the browser. Sometimes, these kinds of generated functions are given names that aren’t very friendly — either single letter names after they’re minified or some obscure or unfamiliar names even when they’re not.
In the sample project, an example of this is AppComponent_Template_app_button_handleClick_1_listener which you see in the stack trace.
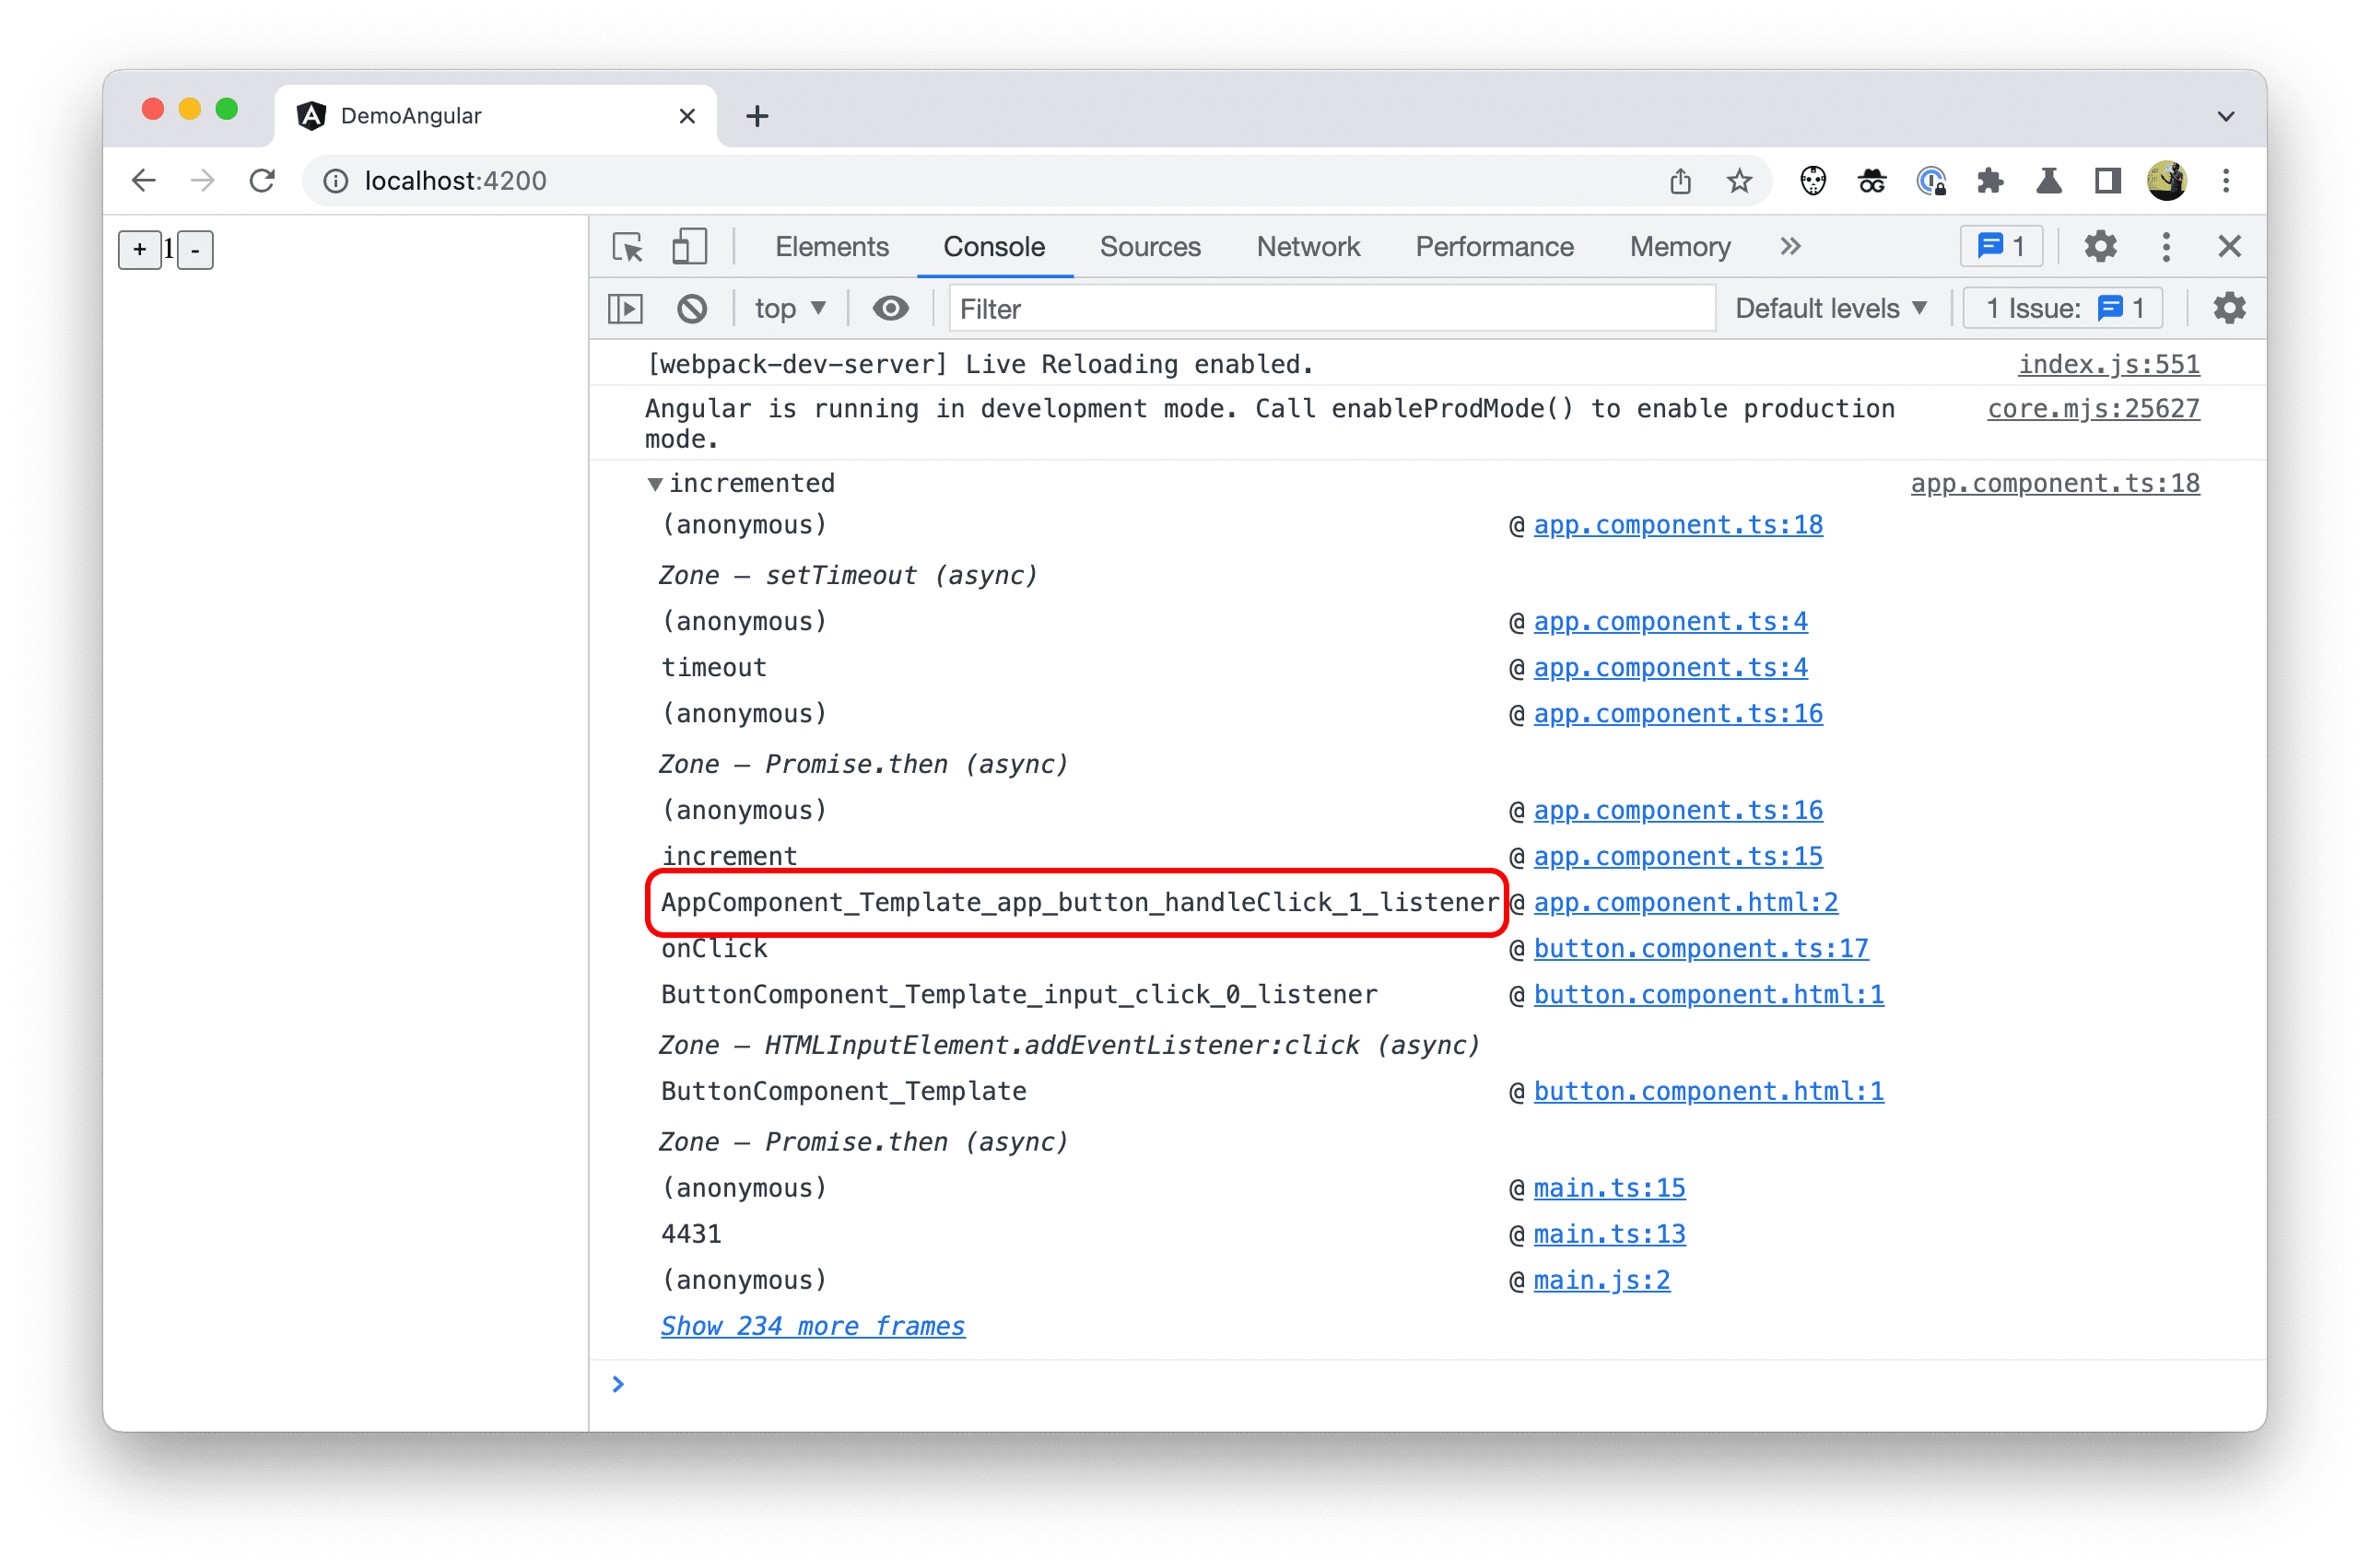
To address this, Chrome DevTools now supports renaming these functions through source maps. If a source map has a name entry for the start of a function scope, the call frame should display that name in the stack trace.
As an author, you don’t need to do anything to enable this new behavior. It is up to the framework to implement this change.
Looking ahead
Thanks to the additions outlined in this post, Chrome DevTools can offer you a better debugging experience. There are more areas that the team would like to explore. In particular, how to improve the profiling experience in DevTools.
The Chrome DevTools team encourages framework authors to adopt these new capabilities. The Case Study: Better Angular Debugging with DevTools offers guidance on how to implement this.


